Grayscale Histogram Analysis
Description
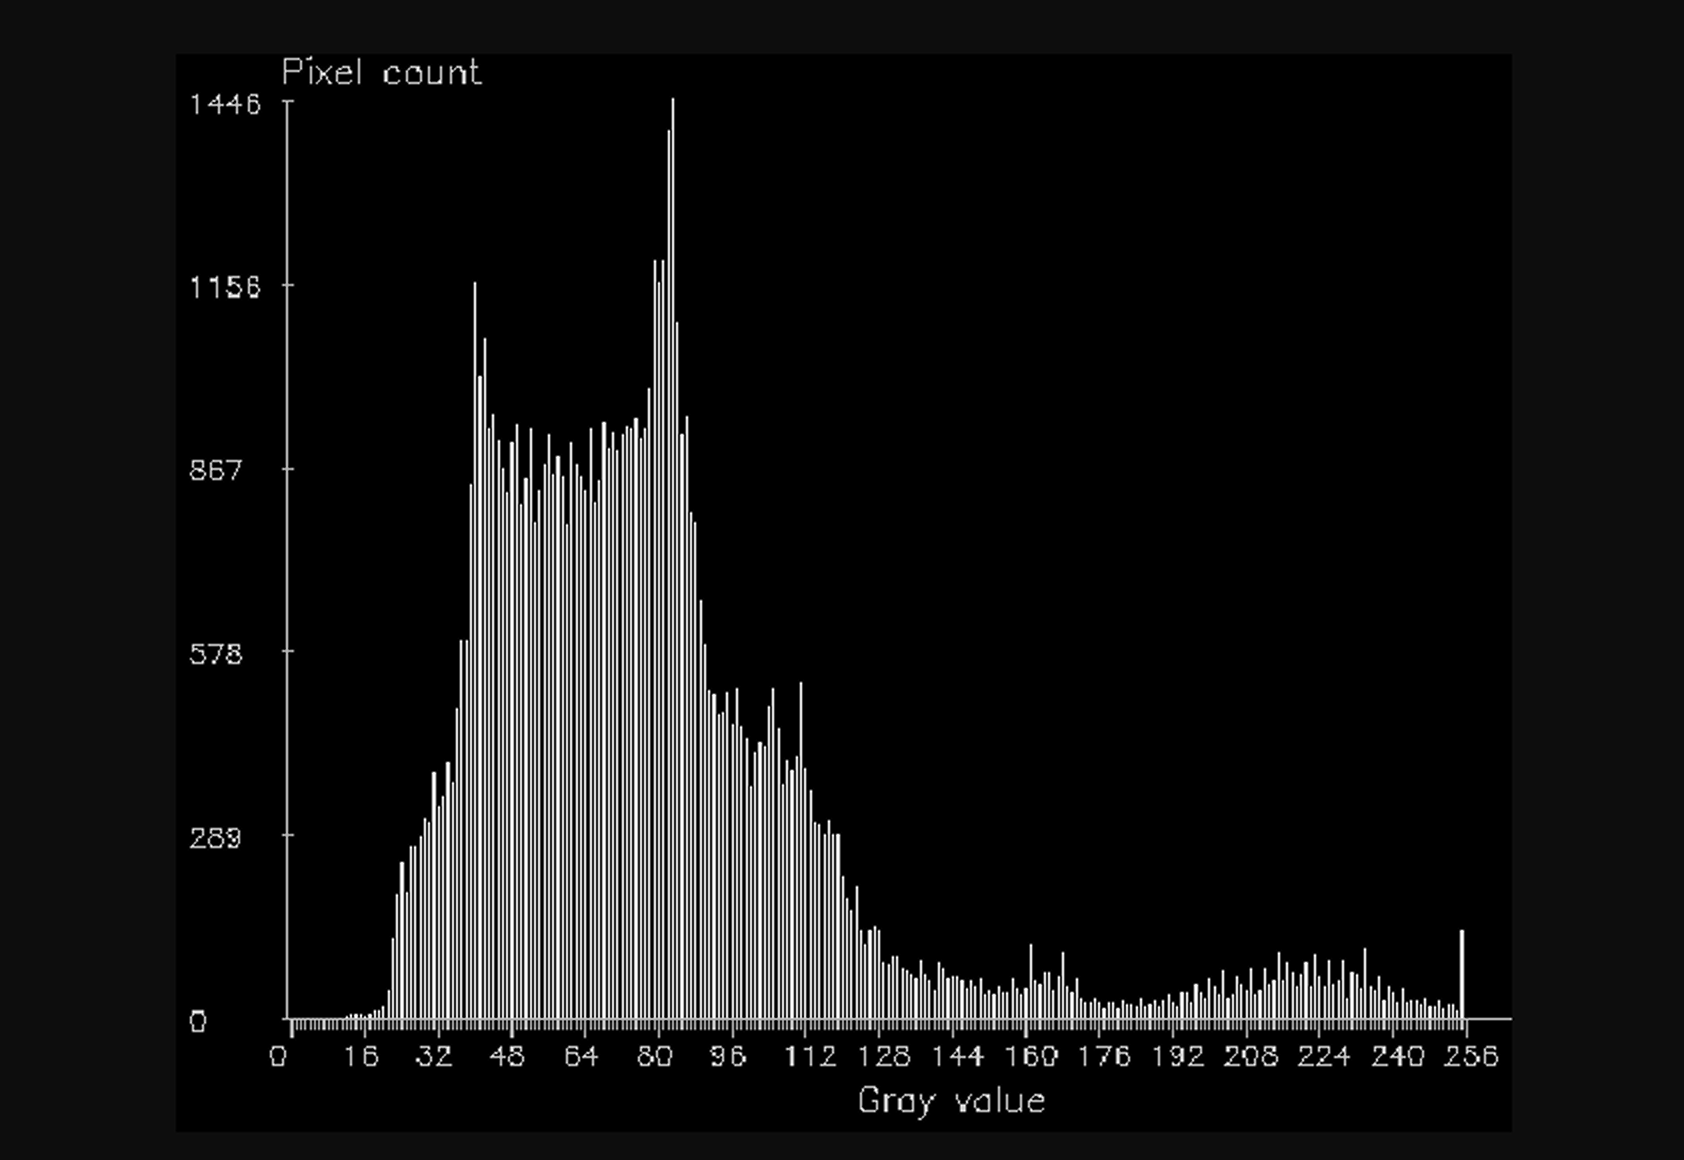
This Step is used to output the grayscale histogram, pixel count, minimum gray value, maximum gray value, median gray value, mode gray value (the most frequently occurring gray value), mean gray value, standard deviation of gray values, and contrast of the image in the specified region of the grayscale image. A grayscale histogram is a statistical representation of the distribution of grayscale levels in a grayscale image, reflecting the frequency of occurrence of each grayscale level.
Usage Scenario
This Step is applicable to scenarios where the grayscale distribution characteristics of an image or a specified region need to be analyzed.
For example, it can be used to check whether a region is generally brighter or darker overall, whether the grayscale distribution is concentrated, and whether the contrast between bright and dark areas is significant, as well as to compare grayscale statistics across different images or regions.
Basic Concepts
-
Grayscale Histogram
The grayscale histogram counts the occurrences of each gray value in a specified region of the image, and can be used to check whether the grayscale distribution is concentrated and whether the image is generally brighter or darker overall.
-
Median, Mean, Mode
The median is the middle value after sorting all gray values, the mean is the average of all gray values, and the mode is the gray value that occurs most frequently. These statistics can be used to describe the overall grayscale level within a specified region of an image from different perspectives.
-
Standard Deviation
The standard deviation is used to measure the degree of dispersion of gray values within a specified region of an image. A larger standard deviation indicates a more dispersed grayscale distribution, while a smaller standard deviation indicates a more concentrated grayscale distribution.
Workflow
The process of configuring this Step is shown below:

-
Configure the input. Connect the ports manually or select the input(s) under Input in the parameter configuration panel.
-
Set the ROI.
-
Select the output item in the Output section, and set the acceptable range for the output item.
-
Run the Step, and view output.
Input Description
| Input Item | Description |
|---|---|
Grayscale Image |
The grayscale image used for grayscale histogram analysis. |
Alignment Parameter Group |
Optional input. This Step is used to adjust the pose of the ROI synchronously based on the pose transformation of the target object. |
Parameter Description
| Parameter | Description |
|---|---|
ROI Settings |
This parameter is used to set the image region selected for grayscale histogram analysis. See 2D ROI Settings to learn how to set and adjust the ROI. |
Output Description
| Output Item | Description |
|---|---|
Grayscale Histogram |
A histogram representing the grayscale distribution of the image. |
Pixel Count |
The number of pixels within the ROI. |
Min Gray Value |
The minimum grayscale value within the ROI. |
Max Gray Value |
The maximum grayscale value within the ROI. |
Mean Gray Value |
The mean grayscale value within the ROI. |
Median Gray Value |
The median grayscale value within the ROI. |
Mode Gray Value |
The mode gray value within the ROI. |
Standard Deviation |
The standard deviation of the grayscale values within the ROI. |
Contrast |
The image is divided into two regions, brighter and darker, using an automatic binarization method. The mean gray value of each region is calculated separately. The contrast is defined as the difference between the mean gray value of the brighter region and that of the darker region. |
Troubleshooting
|
For common errors, see Error Code List. |