Query and Export Data in Mech-MSR
In the “Statistical Report” window of Mech-MSR, you can intuitively view the measurement results from a project over a period of time through data tables and charts and export the queried data.
| The system will start saving relevant results only after you have set the project and measurement items for saving. |
Set Project and Measurement Items
On the toolbar of Mech-MSR’s home interface, click the Setting button next to Statistical Report to open the setting window.

After configuring the Data storage path, Project, and Measurement items, click the Save button to return to the home interface.
| Do not set the Data storage path to the project folder or any of its subfolders. |
View Results
After running the project for a period of time, click the Statistical Report button on the toolbar of Mech-MSR’s home interface to open the “Statistical Report” window.
-
Set the filters.
You can filter data by project, measurement item, search mode (by date range or by recent project runs), and result type according to your actual requirements.

-
Click the Search button, and the results will be displayed under the Production statistics and Historical data tabs on the right side of the window. You can filter the results of up to 100,000 project runs.
You can view the data in the form of a data table or chart.
Production Statistics
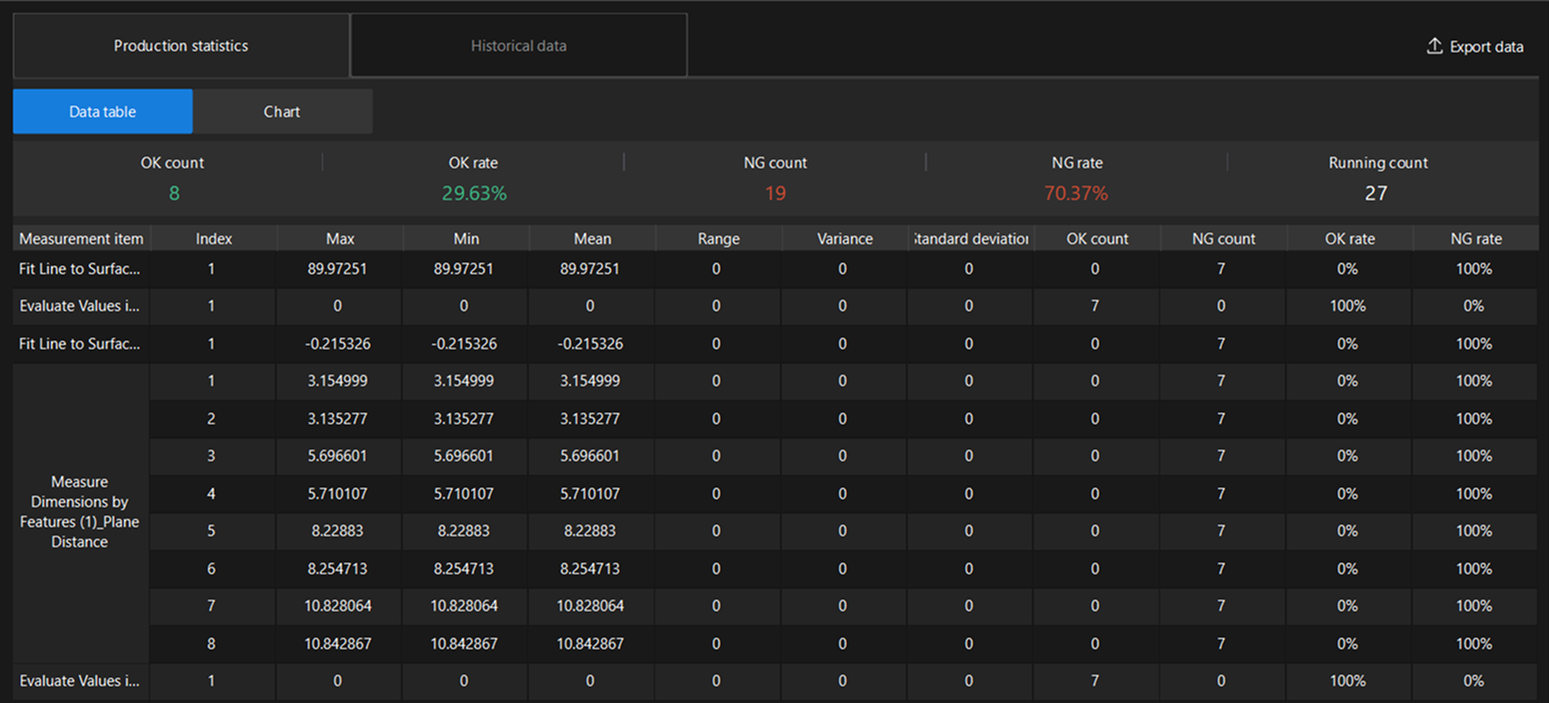
You can view the statistics of the project and measurement items via the Data table under the “Production Statistics” tab.
| The Chart displays the range of measured values. |
-
Statistics of the project
Project-level statistics are displayed at the top of the data table and include the OK count, OK rate, NG count, NG rate, and Running count of the project.
-
Statistics of measurement items
The statistical indicators for measurement items are described as follows:
Indicator Description Index
The index indicates the position of the measured value in the list, starting from 1 and increasing sequentially.
If the result of a measurement item is a single value, the index is displayed as 1. Max
The maximum value measured across multiple measurements. If corrective compensation is applied, this value is the compensated value.
Min
The minimum value measured across multiple measurements. If corrective compensation is applied, this value is the compensated value.
Mean
The average value of multiple measurement results. If corrective compensation is applied, this value is the compensated value.
Range
The difference between Max and Min.
Variance
The average of the squared deviations of each measured value (compensated) from the Mean, reflecting the degree of data dispersion.
Standard deviation
The square root of the Variance, reflecting data fluctuation.
OK count
The number of times the measured value was judged as OK during measurements.
NG count
The number of times the measured value was judged as NG during measurements.
OK rate
OK rate = OK count ÷ Measurement rounds.
NG rate
NG rate = NG count ÷ Measurement rounds.

Export Data
Click the Export data button in the upper-right corner of the window to export the data table of production statistics to the specified location.
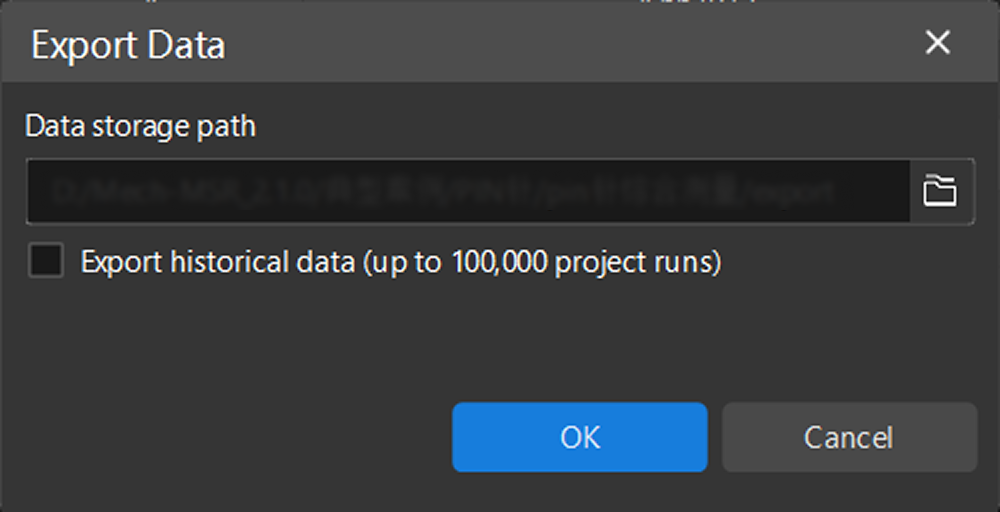
| To export historical data, select Export historical data in the Export Data window. The results of up to 100,000 project runs can be exported. |