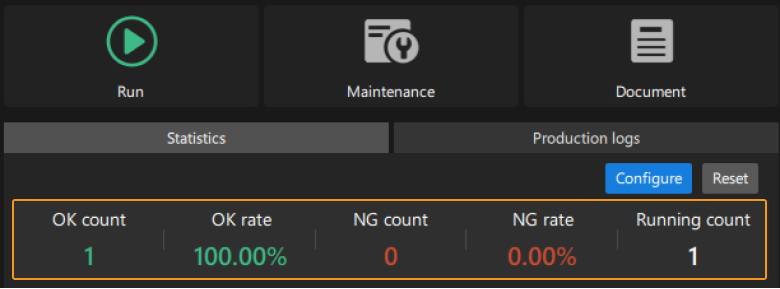
View Statistical Data of Project
You can trigger the project to run in the production interface and then view its statistical data.
Statistical Data of Project
In the panel on the right side of the production interface, click the icon ![]() to run the project associated with the product. After the project is executed, the statistics for the project are instantly updated under the Statistics tab.
to run the project associated with the product. After the project is executed, the statistics for the project are instantly updated under the Statistics tab.

The description of each indicator is as follows:
| Parameter | Description |
|---|---|
OK count |
The number of times the overall quality judgment result of the project was OK during production. |
OK rate |
OK rate = OK count ÷ Running count |
NG count |
The number of times the overall quality judgment result of the project was NG during production. |
NG rate |
NG rate = NG count ÷ Running count |
Running count |
The total number of project runs after entering the production interface. |
| For details on the quality judgment rules for the project, refer to the Quality Judgment section. |