Configure Display Window
According to the configured Image layout, the production interface mainly displays several image windows, allowing users to intuitively view the image data.
Click the configuration icon ![]() at the upper-right corner of each display window and configure the image to be displayed in the pop-up window.
at the upper-right corner of each display window and configure the image to be displayed in the pop-up window.

Configuration Process
Follow the steps below to configure each display window:
-
(Optional) Set feature overlays.
-
(Optional) Set image overlays.
-
(Optional) Set text overlays.
-
(Optional) Set a pose overlay.
Once the settings are completed, click the Save button to save the changes, and the configured image will be displayed in the display window.
|
To zoom in on the image, click the icon |
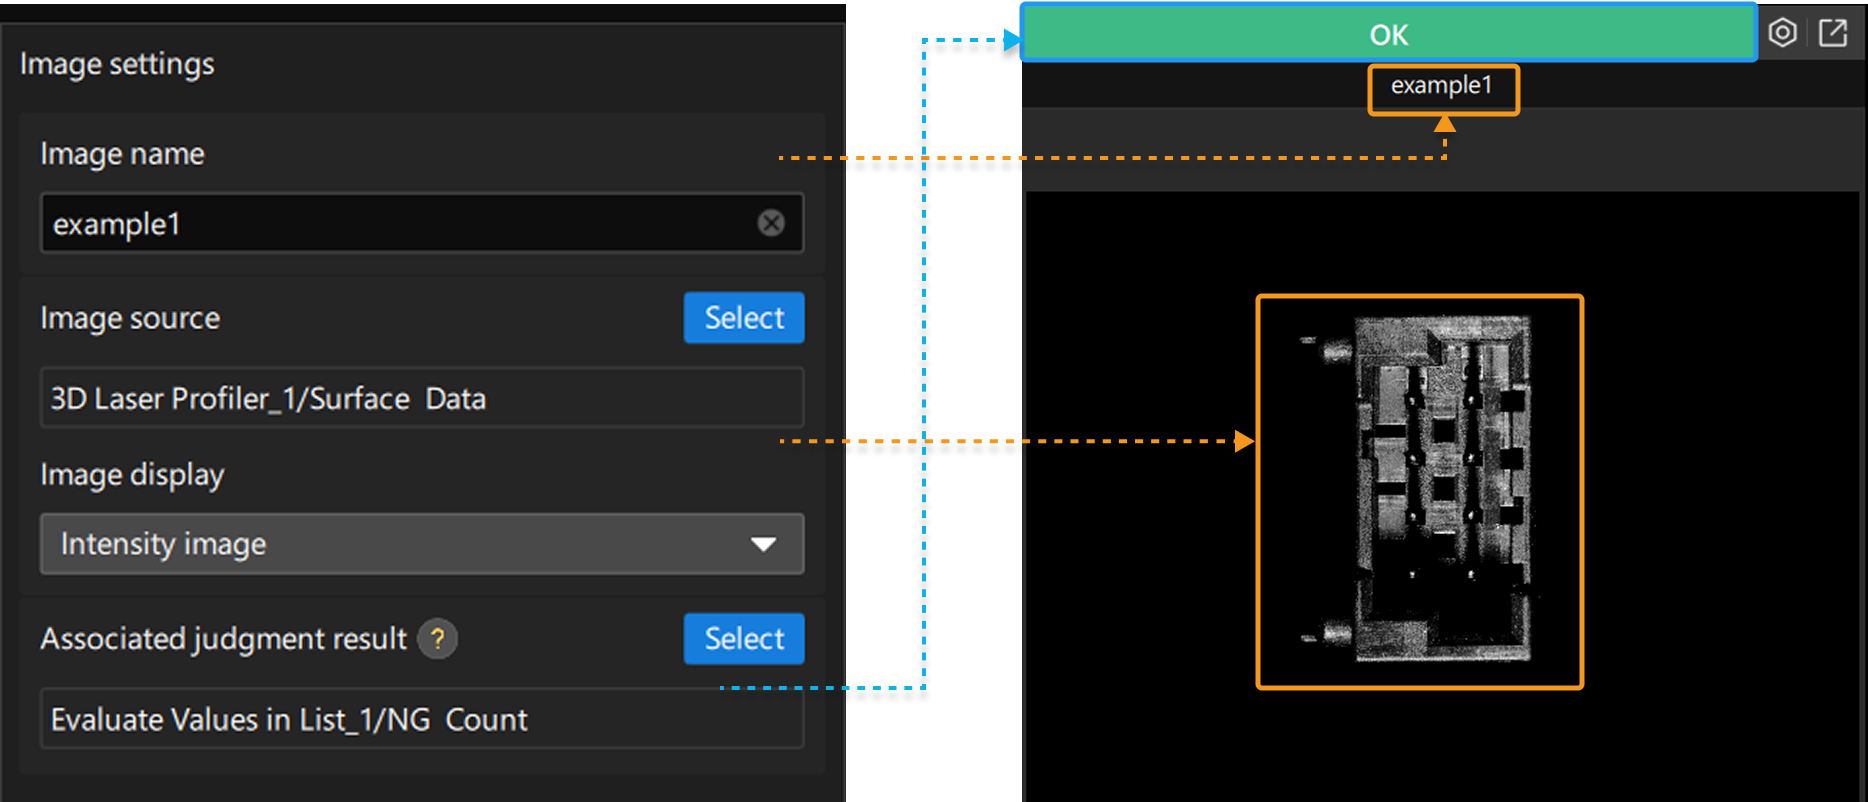
Background Image Settings
According to the actual requirements, set the background image displayed in the window.
| Parameter | Description | ||
|---|---|---|---|
Image name |
The set image name will be displayed at the top of the window. |
||
Image type |
Surface data, Profile, or 2D image can be selected. |
||
Image source |
Click the Select button to select the image to be displayed in the window. |
||
Display mode |
You can set the form of display of the image data. Options: Depth map(pseudo-colored), depth map(grayscale), intensity image 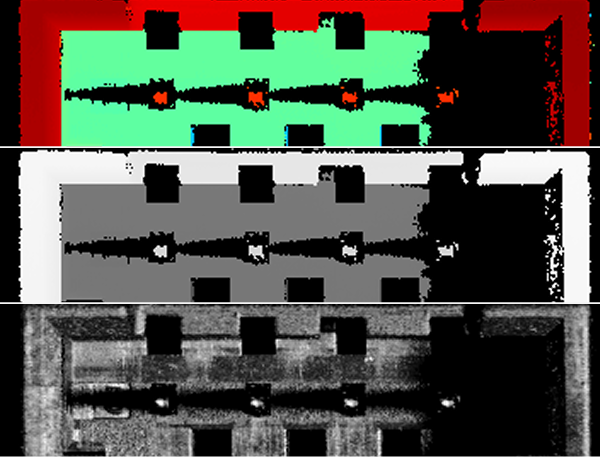
|
||
Associated judgment result |
Click the Select button to select a measurement item to associate. The judgment result for the associated measurement item is the judgment result of the image. The judgment result will be displayed in the upper-left corner of the window, with green indicating OK and red indicating NG. |
Overlay Settings
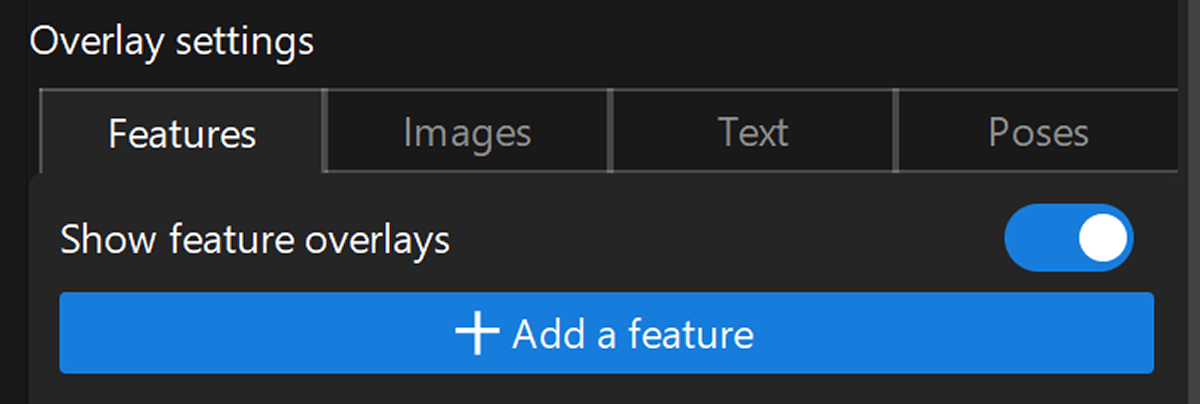
Feature Overlay Settings
Used to overlay features, including points, lines, and circles, on the image. In the Features tab, after enabling Show feature overlays, you can add and set features.
Click the + Add a feature button to add a feature. Up to 5 features can be added. To reduce an added feature, click the delete icon ![]() .
.
| Parameter | Description |
|---|---|
Feature Source |
Click the Select button to select the feature source to overlay on the image. |
Judgment Settings |
After Feature judgment is enabled, you can associate the judgment result with the added feature. This result is derived from the measurement item judgment results of other Steps in the project. Click the Associated judgment result Select button and select the measurement item to associate. The Judgment results will be displayed in different colors of the features. Configure OK color and NG color according to the actual requirement. |
Feature Style |
Set the feature size and color. When Feature Judgment is not enabled, the features will be displayed in one color; when Feature Judgment is enabled, the feature color will be displayed according to the judgment result of the associated measurement item. |
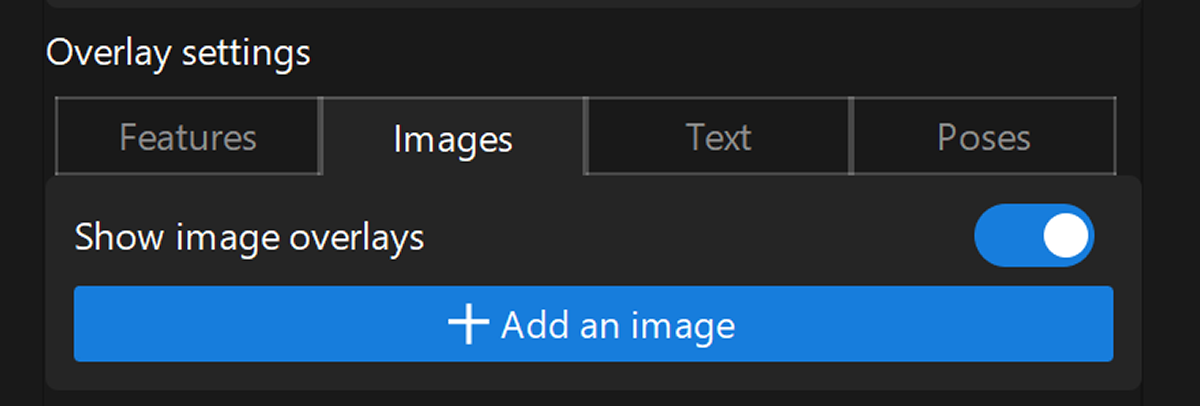
Image Overlay Settings
Used to overlay images in contour or mask mode on the background image. In the Images tab, after enabling Show image overlays, you can add and set images to overlay.
Click the + Add an image button to add an image. Up to 5 image sources can be added.
| Parameter | Description |
|---|---|
Image Source |
Click the Select button to select the image to overlay. |
Judgment Settings |
After Image judgment is enabled, you can associate the judgment result with the added image. This result is derived from the measurement item judgment results of other Steps in the project. Click the Associated judgment result Select button and select the measurement item to associate.
|
Image Style |
Sets the display mode for the overlay image.
|
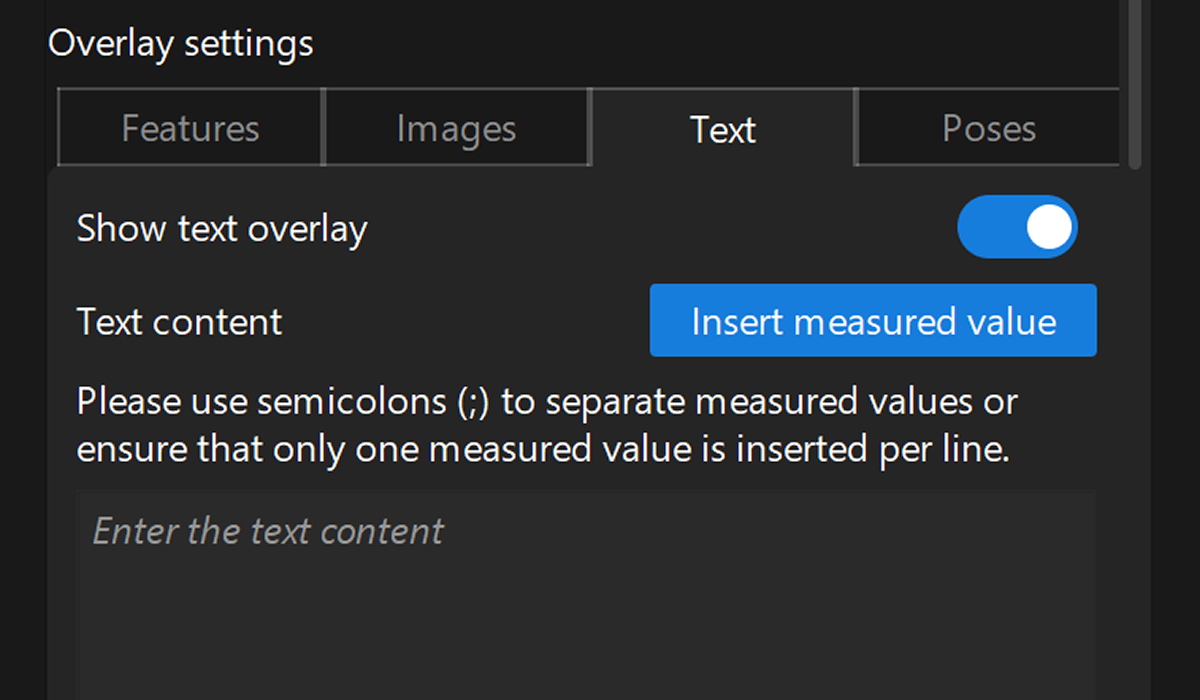
Text Overlay Settings
Used to overlay texts on the image. In the Text tab, after enabling Show text overlay, you can set the text to overlay. Up to 5 measured values can be inserted into the text.
| Parameter | Description | ||
|---|---|---|---|
Text Content |
The overlay text consists of two parts: custom text + inserted measured value. After entering the custom text, click the Insert measured value button and select the measured value to insert. The text content is then set.
|
||
Text Position |
Set the relevant parameters to define the position of the overlay text.
If the text position is not as expected, adjust the following parameters:
|
||
Text Style |
According to the actual requirements, customize the Text size and Text color. |
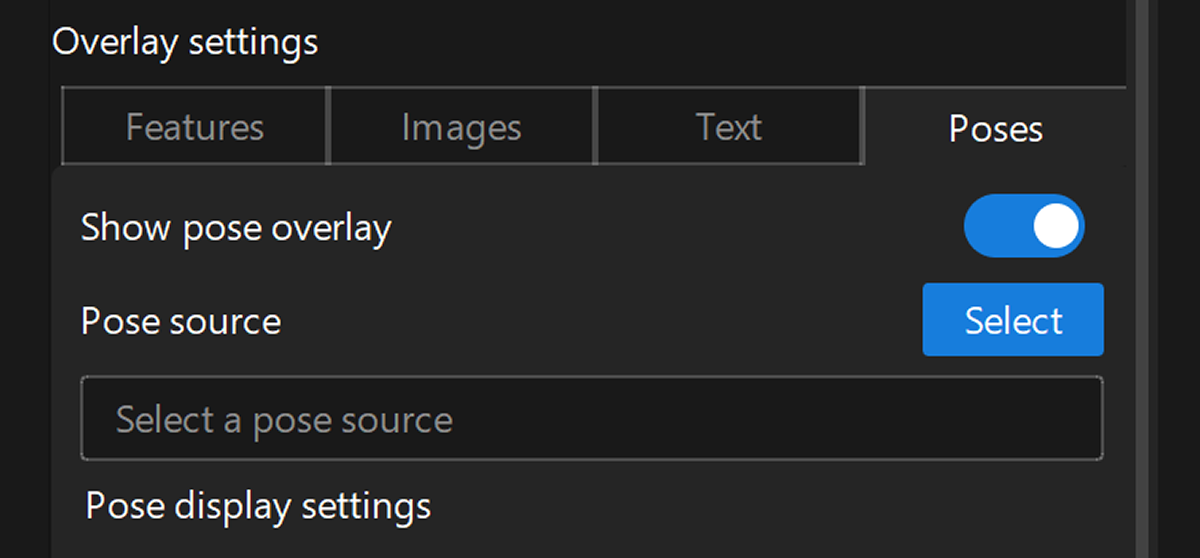
Pose Overlay Settings
Used to overlay pose data on the background image. In the Pose tab, after enabling Show pose overlay, you can set the pose overlay.
| Parameter | Description |
|---|---|
Pose Source |
Click the Select button and select the pose data to be added (the data type is |
Pose Display Settings |
Set the relevant parameters to define the display style of the overlaid pose. You can customize the display of point size, color, axis, number, label, etc. |