Start Detection
The data range has been narrowed down after data processing. Next, you can use the data to detect depressions on the surface.
Detection Workflow
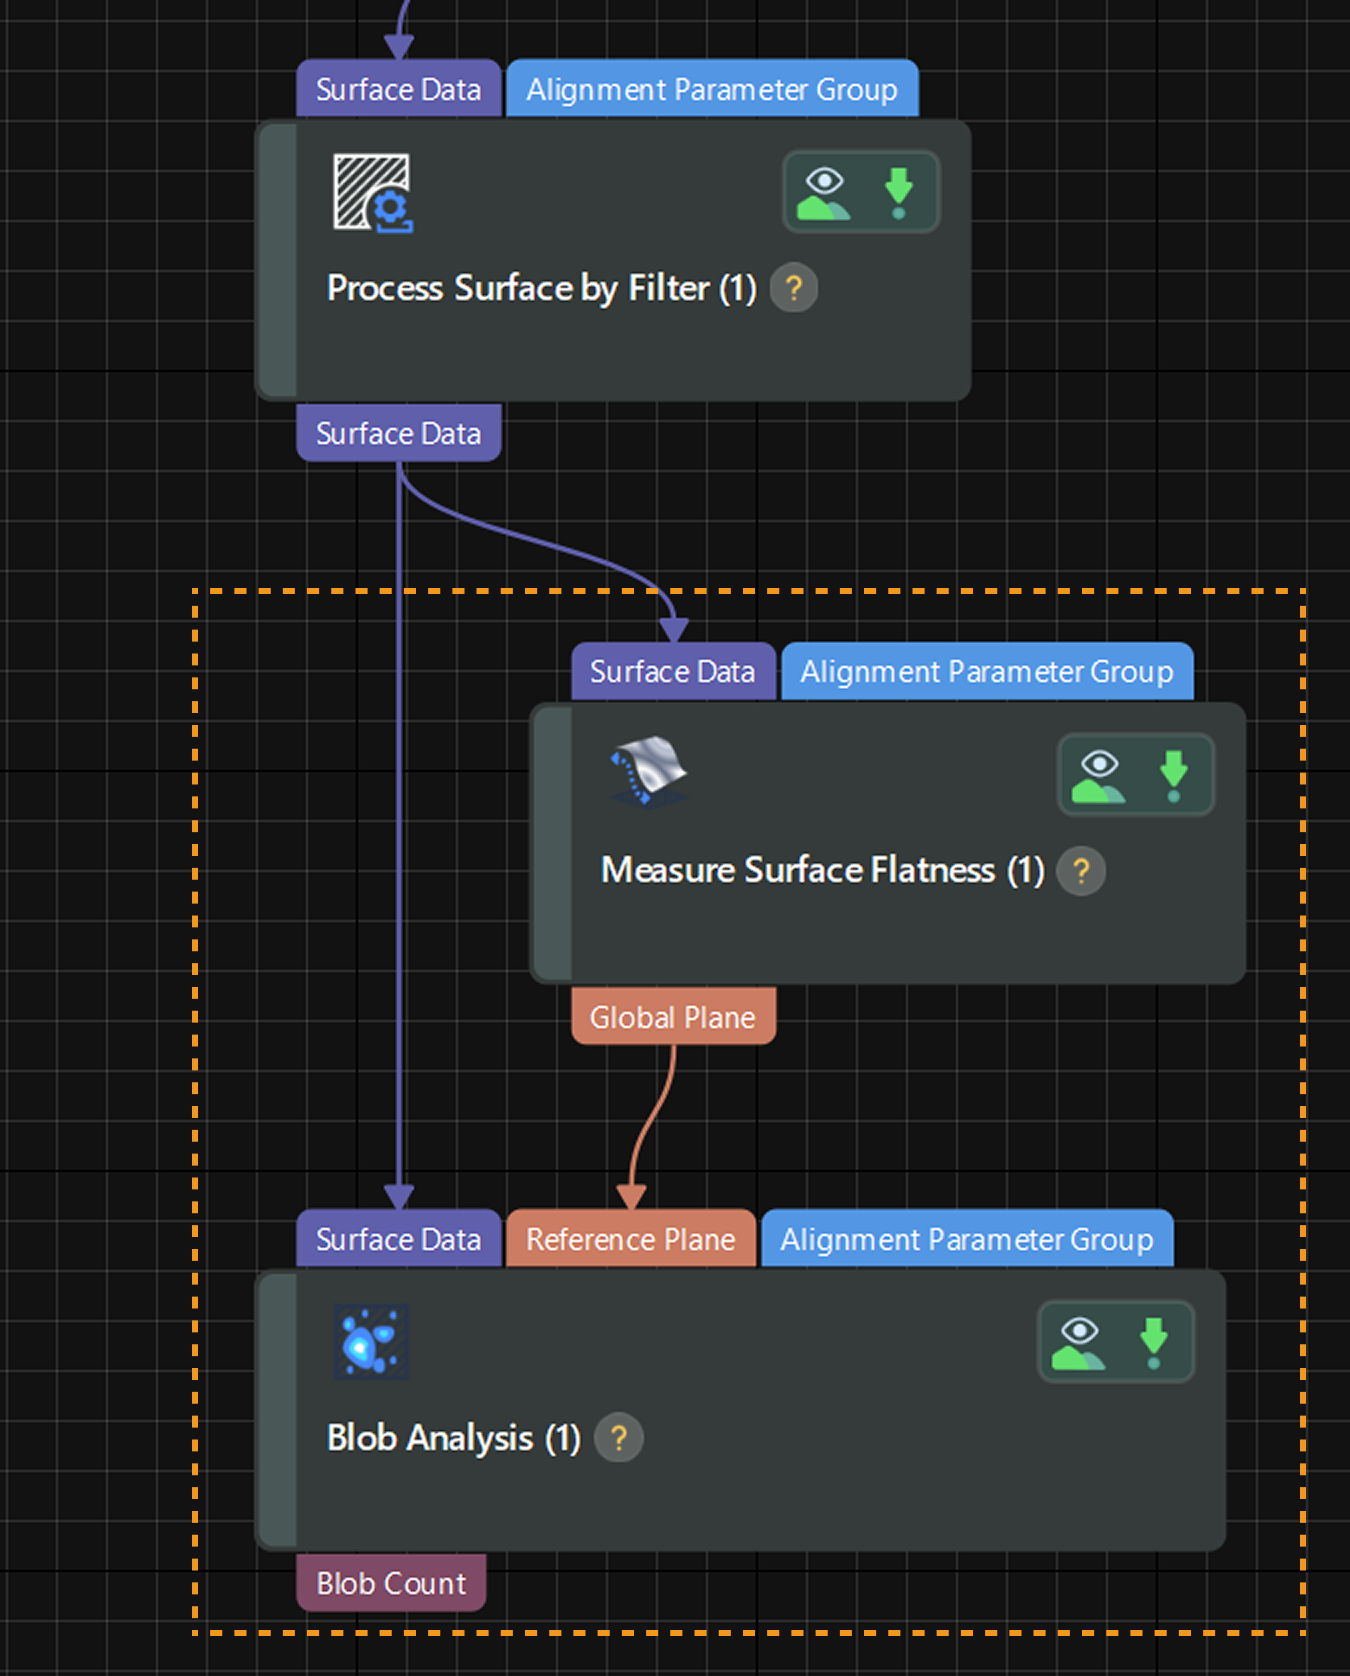
To detect the depressions on the surface of the brake pad, you can first fit a reference plane and then accurately detect defects on this basis.

Fit a Reference Plane
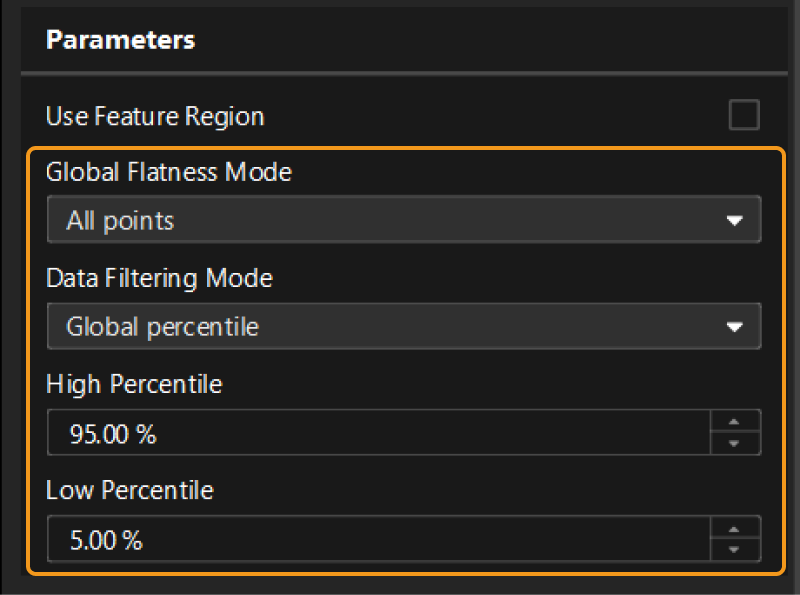
Data points at depressions on the surface of the brake pad usually have Z values lower than the surrounding flat surface. Given this characteristic, you can use the Measure Surface Flatness Step to fit a reference plane from the extracted surface data and detect points that are obviously lower than the reference plane.
The parameter configuration of this Step is shown below.

| For more details on parameters, see Parameter Description. |
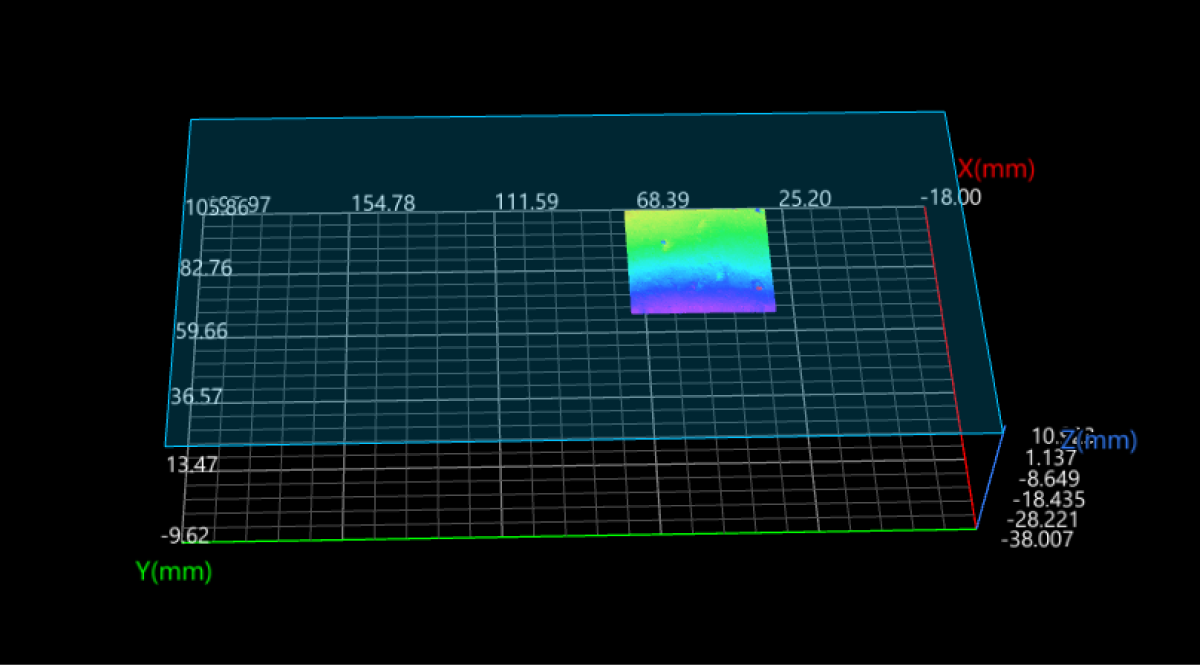
After the Step is run, it will output a fitted reference plane.

Defect Detection
After a reference plane is fitted, you can use the Blob Analysis Step to detect depressions.
The parameter configuration process of the Step is as follows:
-
Select Reference plane from the drop-down list under the “Reference Type” parameter. Upon selection, a reference plane input port will be added to the Step for the input of the fitted reference plane.
-
Under “Threshold Settings,” set the Height Threshold to -0.100 and the Threshold Filter to Below. The settings can help rapidly detect the data points that are obviously lower than the reference plane.
-
For the setting of the area filter, you can configure the Max Area and Min Area to define the acceptable area range for a depression. In the example project, they are set to 50.0000 and 0.5000, respectively.
-
Set the Blob Search Mode to External blobs. This setting can be used to exclude nested depressions, and only the outermost depressions can be detected.
-
In the Output section, select the measurement items according to actual needs. In the example project, the Blob Count item is selected.
| For more details on parameters, see Parameter Description. |
After the Step is run, it will output the measured result according to the parameter settings. You can view the running results in real time in Output Results panel at the bottom of the data visualization area.
Next, you can set an acceptable range for the measurement item to obtain the inspection results.