Extract Surface Section
Description
This Step is used to extract a profile from the surface data. It forms a section perpendicular to the XOY plane by using the line connecting two feature points, the centerline of a feature region, or the horizontal centerline of the surface data and extracts the intersection line between that section and the surface data to generate a profile.
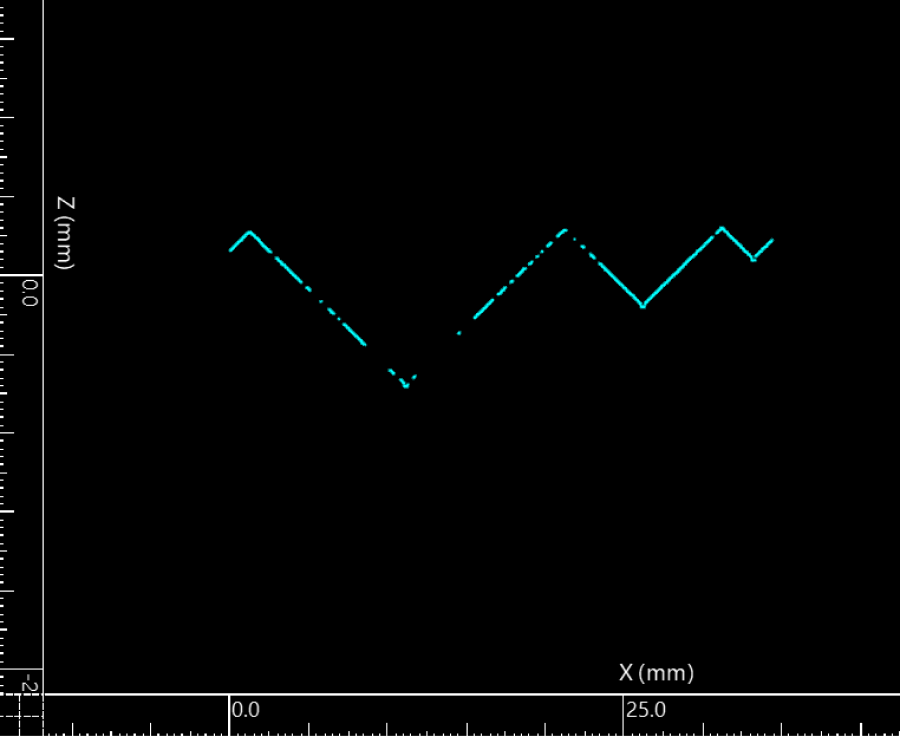
The intersection line extracted from the surface may have different orientations, but the Profile output by this Step is transformed onto the XOZ plane with the start point at X = 0. The coordinate output items still represent the original spatial coordinates of the endpoints of the extracted profile.
|
|
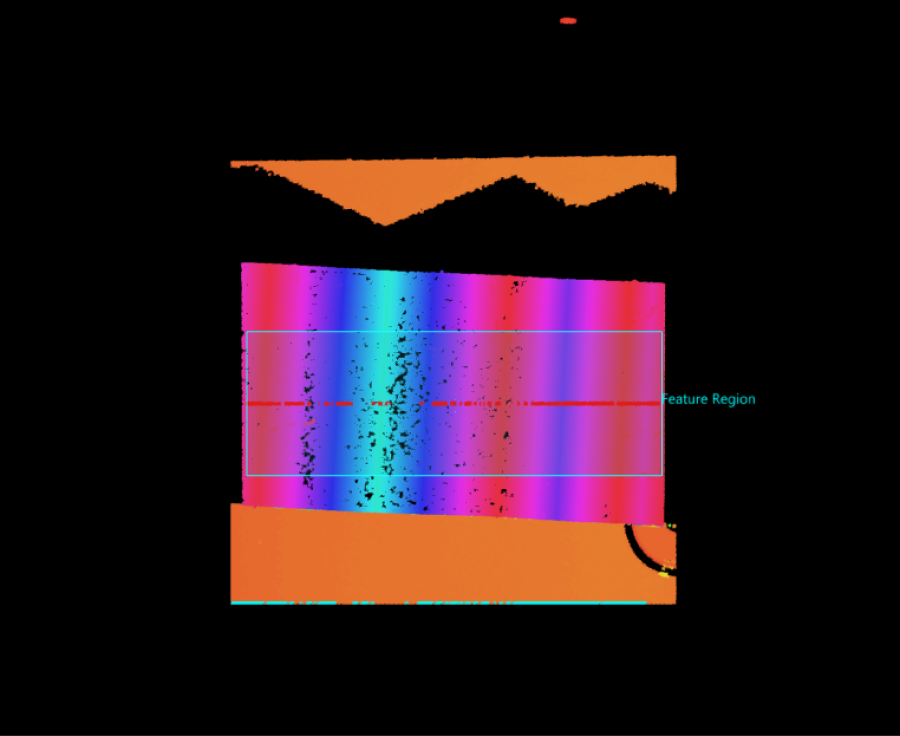
Uses a feature region to extract a section profile |
Profile output by the Step |
Workflow
The process of configuring this Step is as follows:

-
Configure the input. Connect the Step ports in the graphical programming workspace or select the input under Input in the parameter configuration panel.
-
Set Sectioning Mode.
-
Set other parameters.
-
Select the desired output items under Output. For an expandable output item, click ▶ and configure the Lower Limit and Upper Limit values to set the acceptable range.
Parameter Description
First, it is necessary to confirm Sectioning Mode, namely the method for extracting a section profile from surface data. You can select Feature region, Feature points, or Horizontal centerline.
-
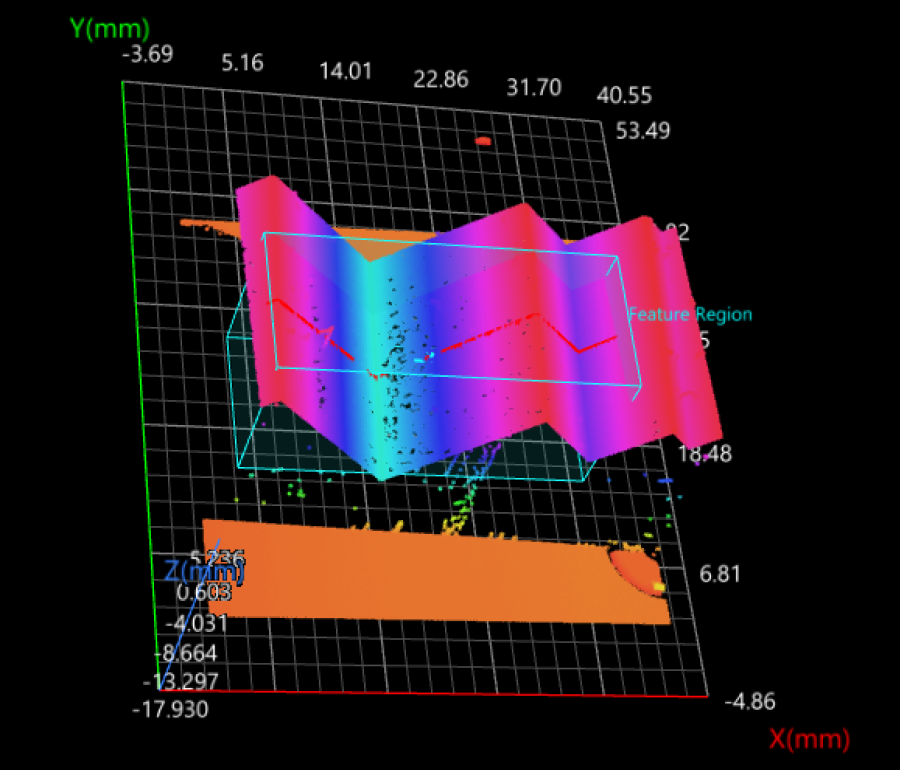
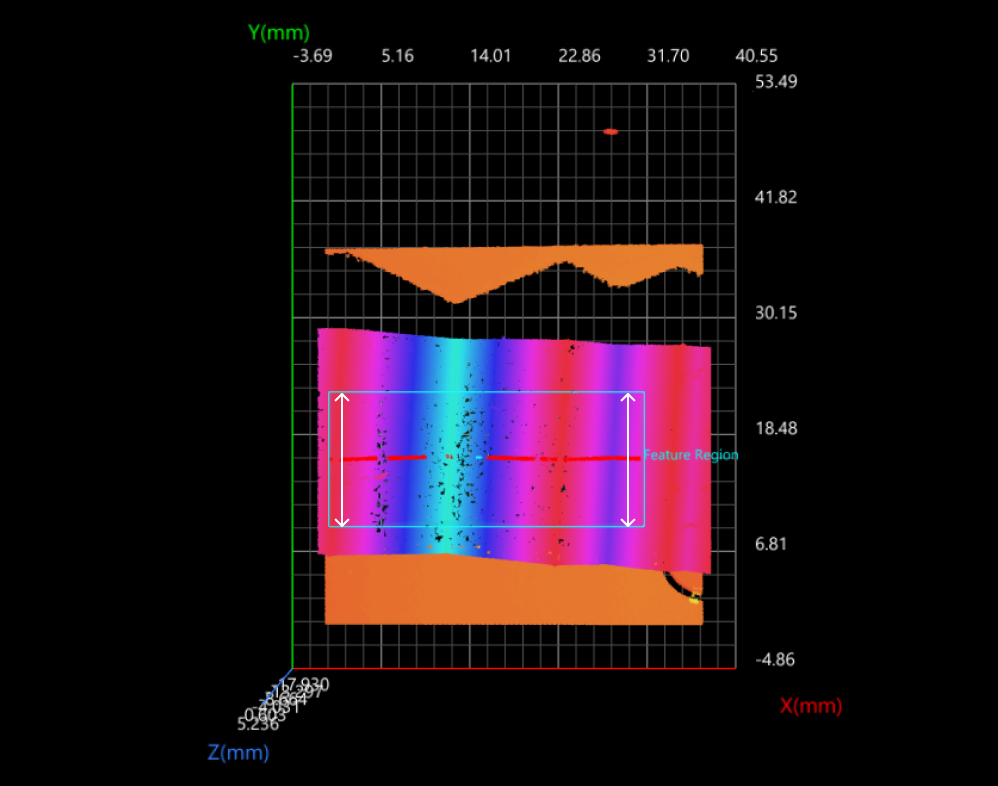
Define a feature region on the surface, and a plane perpendicular to the XOY plane and passing through the center line of the region will be formed to intersect with the surface data and thus produce a section profile (the red lines shown in the figure below). The center line of the feature region is the line initially connecting the midpoints of two edges along the Y-axis.
See Feature Region to learn about how to adjust a feature region. 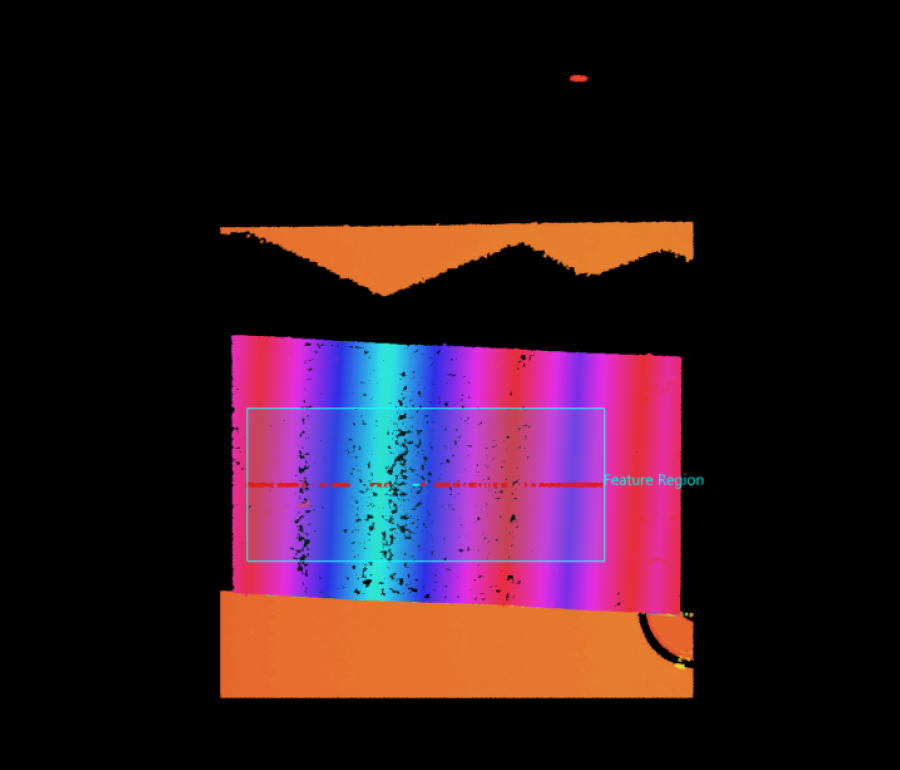
2D image
3D image
-
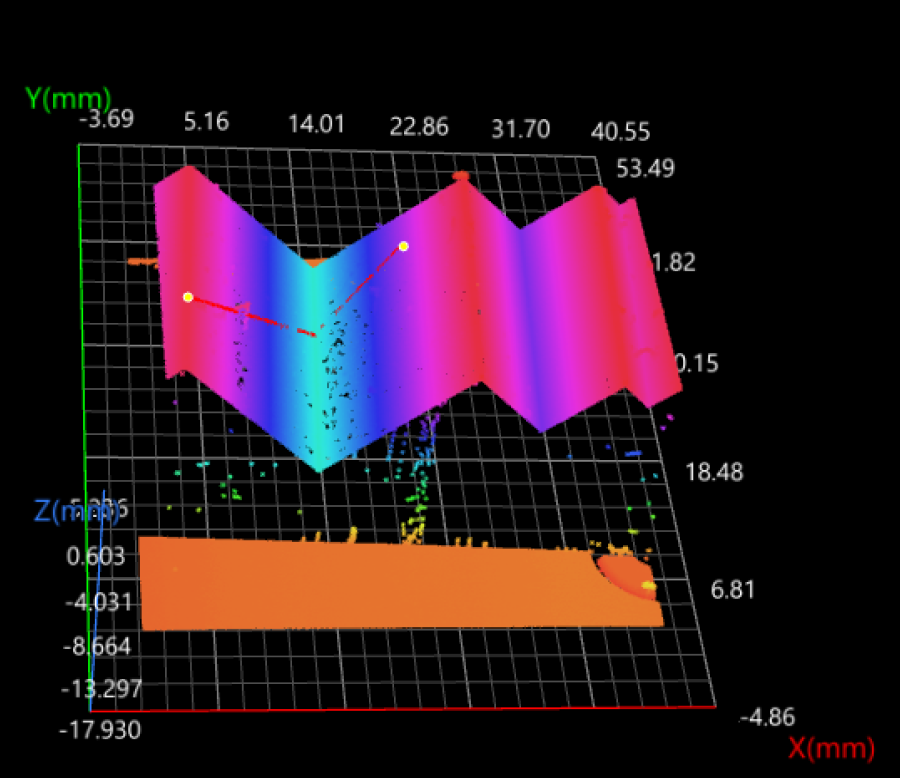
Select two data points from the surface data as feature points. The plane perpendicular to the XOY plane and passing through the two feature points is thus formed to intersect with the surface data, generating a profile (the red lines shown in the figure below). The endpoints of the profile are the two feature points (the two yellow dots shown in the figure below).
In this case, two feature points are the required input of the Step. You need to connect the ports manually or configure the input under Input.
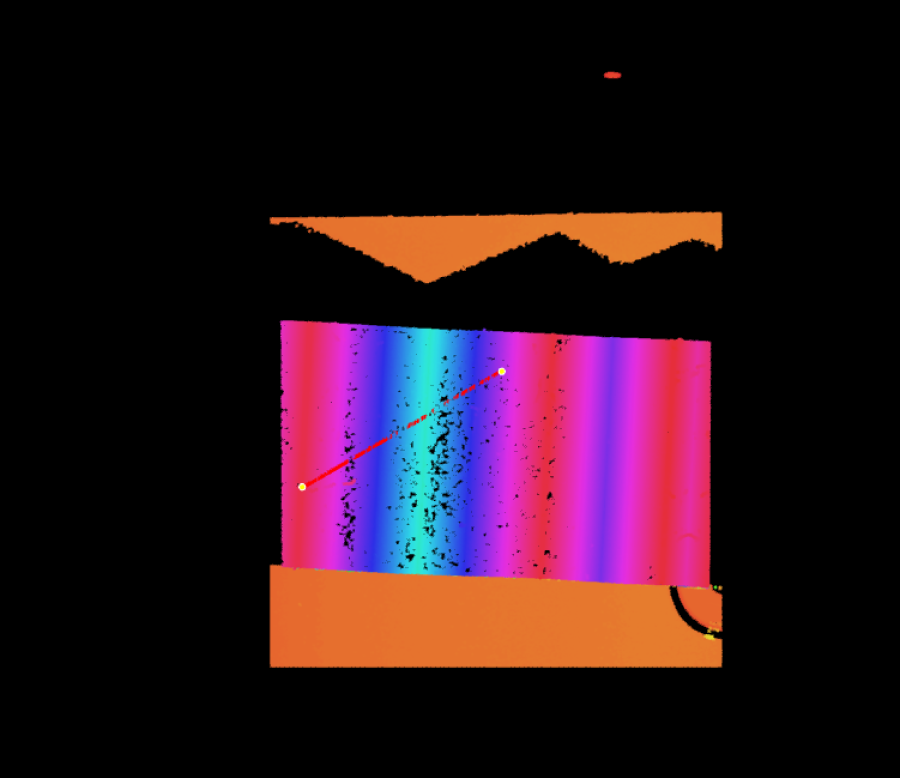
2D image
3D image
-
The section perpendicular to the XOY plane and passing through the horizontal centerline of the bounding box of the surface data intersects with the surface to generate a profile. Here, “horizontal” refers to the X direction of the surface data.
This mode is suitable when you need to quickly extract a profile from the middle of the surface data.
|
Feature points provide precise positional information, specifying the endpoints of an intersection to form a plane perpendicular to the surface. It is preferable to use feature points when you already know exactly where the endpoints are located. Feature region helps you define the position of the sectioning plane more flexibly. If you want to extract the profile from a wide region and do not need to specify endpoints, a feature region may be a better choice. Horizontal centerline is suitable when no additional locating information is needed and you only want to quickly extract a profile from the middle of the surface data. |
Next, adjust corresponding parameters according to the selected sectioning mode.
The Sectioning Mode Is “Feature Region”
| Parameter | Description | ||
|---|---|---|---|
Feature Region |
The region for extracting a profile from surface data. Visible only when Sectioning Mode is set to Feature region. See Feature Region to learn about how to adjust a feature region. |
||
Average Profiles |
If the parameter is not selected, a profile will be generated with the raw data points (which may be empty) on the intersection directly without averaging. If the parameter is selected, the average Z value of the data points is calculated within the length of the feature region, along the direction perpendicular to the center line of the feature region. The averaged data points (which may be empty) form a profile.
|
||
Min Valid Points |
Visible only when the Average Profiles parameter is selected. This parameter is used to limit the percentage of valid points within the length range of the feature region. The value range is 0% to 100%. If the actual percentage of valid points is lower than this parameter, the data point at that position is considered non-existent.
|
||
Show Detail |
Once this setting is enabled, the generated profile will be displayed on the original data. |
The Sectioning Mode Is “Feature Points”
| Parameter | Description | ||
|---|---|---|---|
Average Profiles |
If the parameter is not selected, a profile will be generated with the raw data points (which may be empty) on the intersection directly without averaging. If the parameter is selected, the average Z value of the data points is calculated within Averaging Width, along the direction perpendicular to the line connecting the two feature points. The averaged data points (which may be empty) form a profile. |
||
Averaging Width |
The pixel width considered when performing averaging along the direction perpendicular to the line connecting the two feature points. Visible only when the Average Profiles parameter is selected. |
||
Min Valid Points |
Visible only when the Average Profiles parameter is selected. This parameter is used to specify the percentage of valid points within Averaging Width. The value range is 0% to 100%. If the actual percentage of valid points is lower than this parameter, the data point at that position is considered non-existent.
|
||
Show Detail |
Once this setting is enabled, the generated profile will be displayed on the original data. |
The Sectioning Mode Is “Horizontal Centerline”
In this mode, the Step uses the horizontal centerline of the bounding box of the surface data as the sectioning reference to generate a profile. Here, “horizontal” refers to the X direction of the surface data.
No need to set a feature region or input feature points.
| Parameter | Description | ||
|---|---|---|---|
Average Profiles |
If the parameter is not selected, a profile will be generated with the raw data points (which may be empty) on the intersection directly without averaging. If this parameter is selected, the data points on the intersection line are averaged. The averaged data points (which may be empty) form a profile. |
||
Min Valid Points |
Visible only when the Average Profiles parameter is selected. This parameter is used to limit the percentage of valid points during averaging. The value range is 0% to 100%. If the actual percentage of valid points is lower than this parameter, the data point at that position is considered non-existent.
|
||
Show Detail |
Once this setting is enabled, the generated profile will be displayed on the original data. |
Output Description
Select the output item(s) to add the output port(s) to the Step, and the corresponding data will be output after the Step is run. You can select the output according to the actual measurement requirements.
|
If you select an expandable output item, you must expand it by clicking ▶, and then set the Lower Limit and Upper Limit values to determine the acceptable range. If the output value falls within the acceptable range, the measurement item is judged as OK; otherwise, it is judged as NG. |
| Output Item | Description |
|---|---|
Profile |
The resulting profile. The output profile data has been transformed onto the XOZ plane, with the start point at X = 0. |
Start X |
The original X coordinate of the start point of the extracted profile. |
End X |
The original X coordinate of the end point of the extracted profile. |
Start Y |
The original Y coordinate of the start point of the extracted profile. |
End Y |
The original Y coordinate of the end point of the extracted profile. |
Rotation Angle |
The rotation of the extracted profile counterclockwise around the Z-axis (the angle between the extracted profile and the positive X-axis). |
Troubleshooting
|
CV-W2201
Error: The “Min Valid Points” value is not within [0, 1].
Possible cause: The set value of “Min Valid Points” is not within 0% to 100%.
Solution: Reset “Min Valid Points” and ensure that the value is within 0% to 100%.