Result Display Panels of Mech-MSR
The running results of Mech-MSR are displayed in two different panels of the user interface:
-
Result display I: It displays the quality judgment results of an individual project.
-
Result display II: It displays the input or output data of each Step.
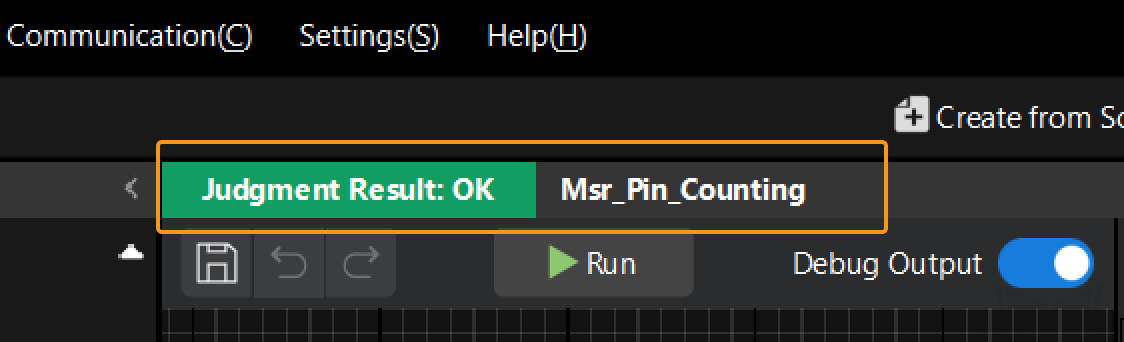
Result Display I
Result display I is above the graphical programming workspace, where the quality judgment result (OK or NG) is displayed after the project is run.
|
See also
Result Display II
Result display II is below the data visualization window (data viewer) and mainly displays the output data of the Step.
|
Enable Debug Output |
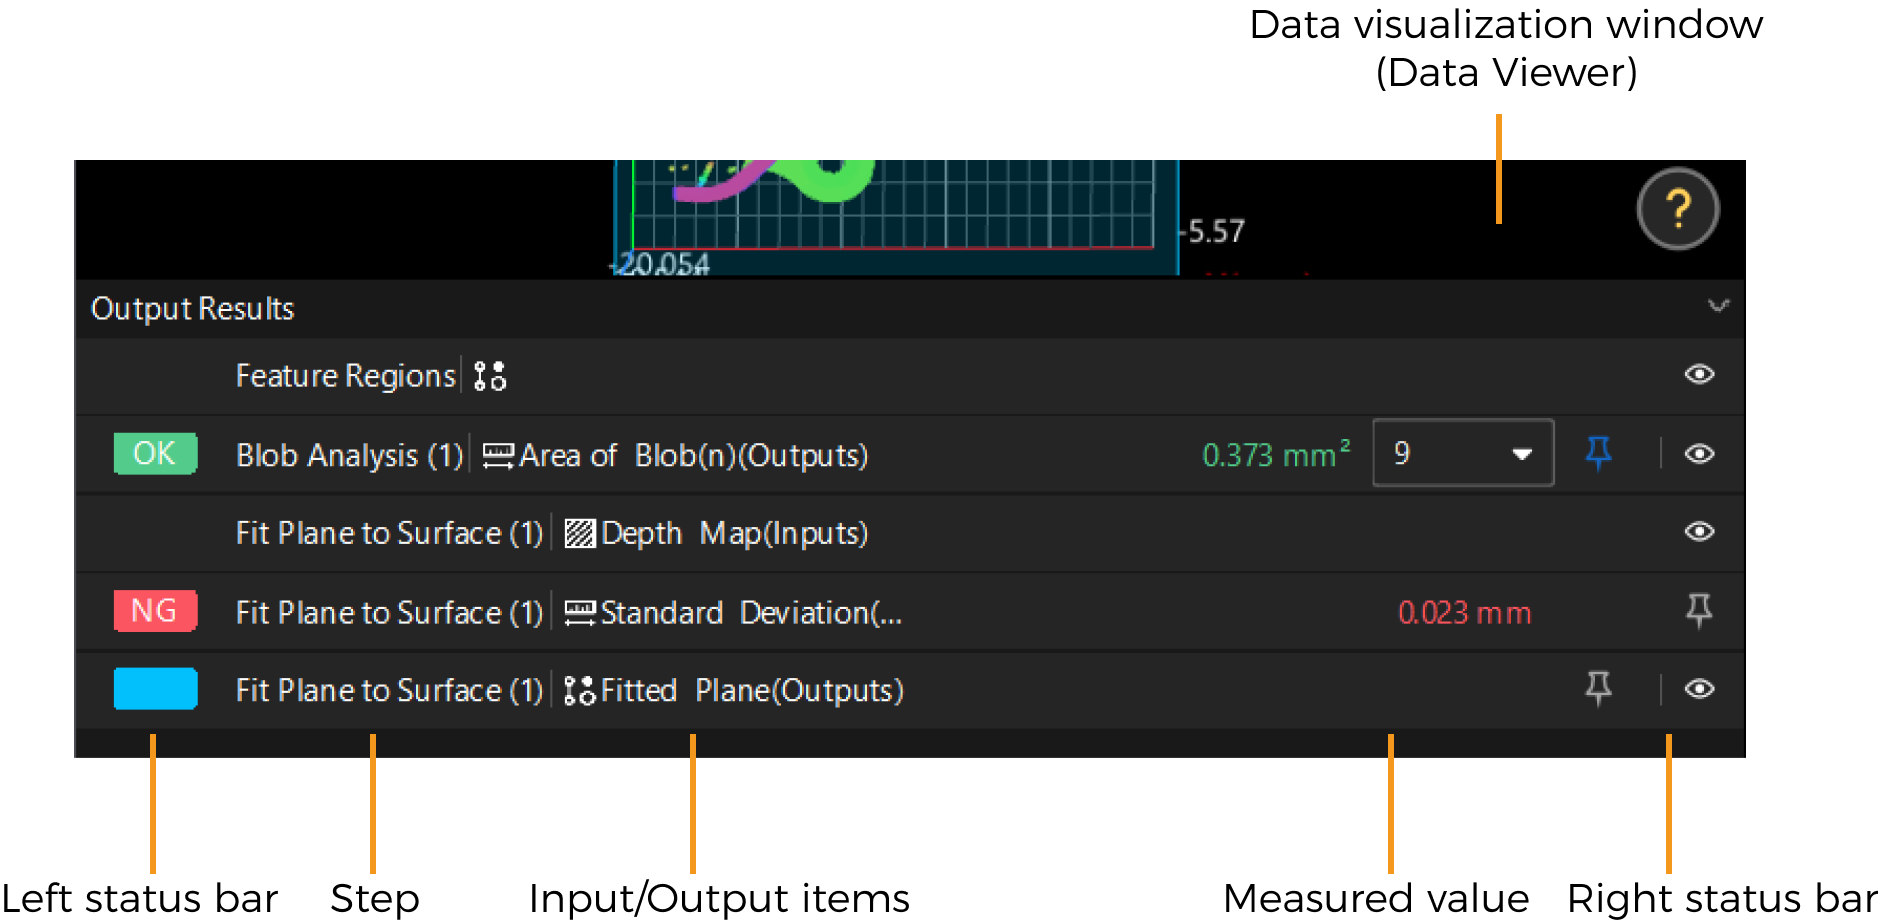
The icons and their descriptions in the Result display II are shown in the table below.
| Icon | Location | Description |
|---|---|---|
|
Left status bar |
The measured result is judged as OK. |
|
Left status bar |
The measured result is judged as not good (NG). |
|
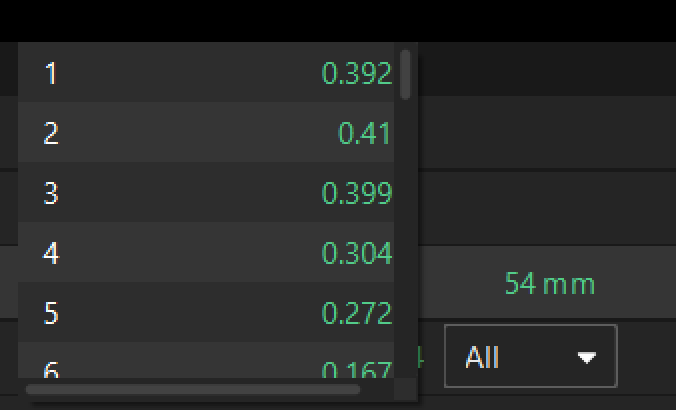
Measured value |
If there is a drop-down list, it indicates that the measurement item has multiple results, which are displayed by serial numbers in the drop-down list.
|
|
Right status bar |
Click the icon to open the Data Details window, displaying all the data corresponding to the measurement item. |
|
Right status bar |
In the open-eye state, the input or output data is displayed in the data visualization window. Click this icon to switch to the closed-eye state. |
|
Right status bar |
In the closed-eye state, the input or output data is not displayed in the data visualization window. Click this icon to switch to the open-eye state. |
|
Right status bar |
The gray pin indicates that the input or output data can be pinned to the Output Results panel. Click to turn it into blue. |
|
Right status bar |
The blue pin indicates that the input or output data has been pinned to the Output Results panel and will still be displayed after switching to another Step. Click to turn it into gray. |

|
After you set the Corrective compensation value for the measurement items under the Communication output tab of the Output Management window, the measured values before and after compensation will be displayed in the Output Results panel, where the value before compensation will be put in parentheses. 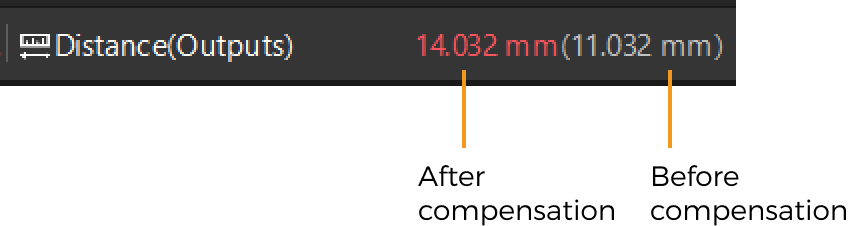
|
See also