User Interface of Mech-MSR
This chapter introduces Mech-MSR’s welcome screen and home interface.
Welcome Screen
If there is no autoloaded solution or project, Mech-MSR will display the welcome screen when you open it, as shown below.
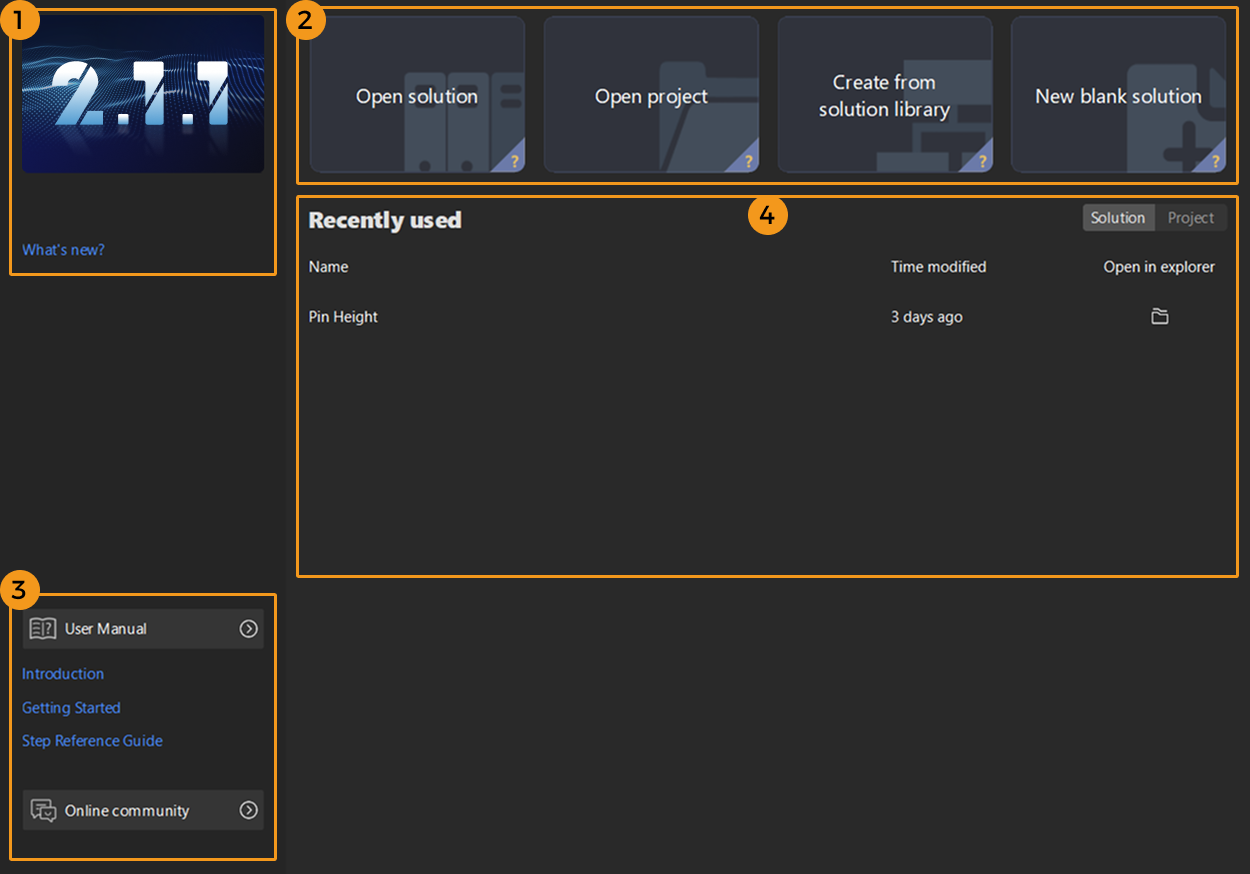
The welcome screen of Mech-MSR consists of the following parts.
| No. | Area | Description |
|---|---|---|
1 |
Version information |
Check version information and release notes. |
2 |
Quick entry |
Quick access for the user to open a solution, open a project, create a solution from solution library, and create a new blank solution. Hover the cursor over the “?” in the lower right corner of the card to check the introduction. |
3 |
User manual and online community |
You can browse Mech-MSR’s user manual or access the online community for questions and discussions by clicking the relevant buttons. |
4 |
Recently used |
Quickly open recently used solutions or projects. |
Home Interface
Leave the welcome screen and you will enter the home interface of Mech-MSR, as shown below.
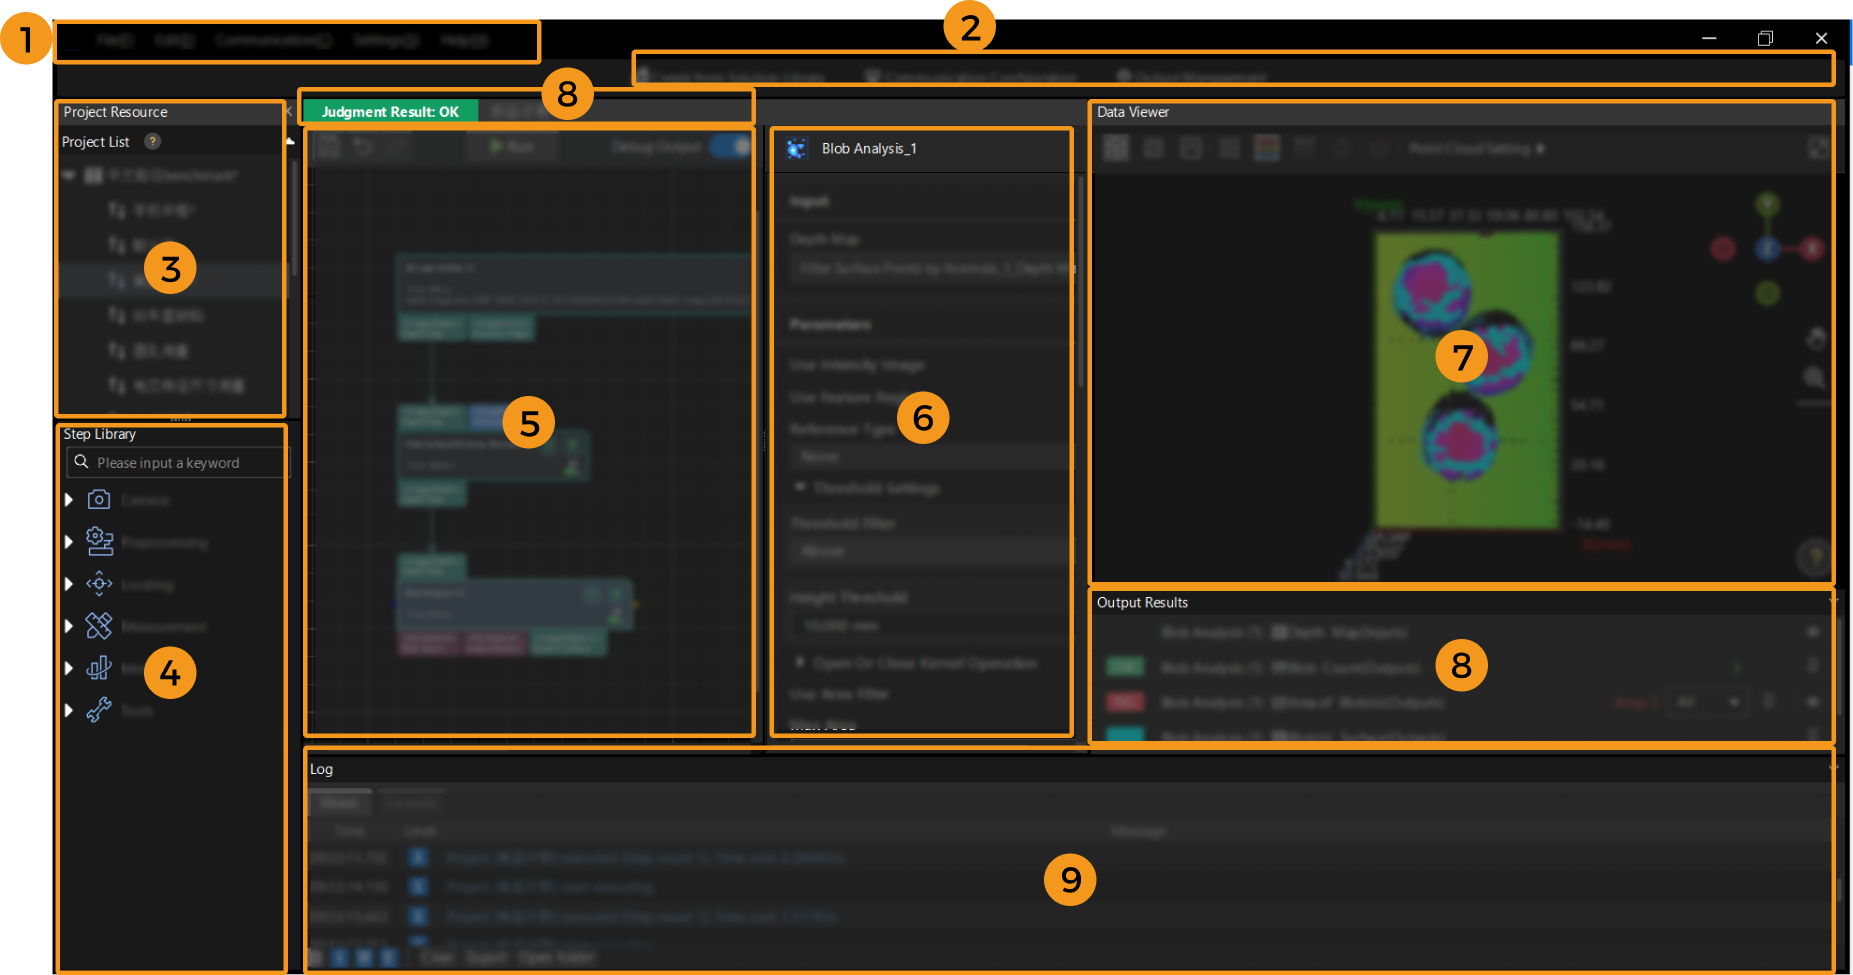
The home interface of Mech-MSR consists of the following parts.
| No. | Area | Description |
|---|---|---|
1 |
Includes File, Edit, Communication(C), Deep Learning(D), Camera(M), Toolkit(T), Settings(S), Help(H), etc. |
|
2 |
Includes buttons to quickly access tools and functions. |
|
3 |
Project list displays opened solutions and projects and their status, including project number, communication status, and autoload status. |
|
4 |
Includes all Steps that can be used to build a project. You can view all Steps by using the All, 2D, and 3D tabs. |
|
5 |
Edit the processing or logical flows of a vision project. |
|
6 |
Used to configure the input, parameters, and output of a Step. |
|
7 |
It can be divided into 2D data view and 3D data view. These views are used to visualize data, set ROIs or feature regions, and view the execution results of Steps. |
|
8 |
Displays the quality judgment result of a project, input and output of Steps. |
|
9 |
Displays the vision log, console log, and operation log in real time, facilitating users to find the execution record. |
See also