FAQs on Steps
This section presents some Steps related frequently asked questions (FAQs) and their answers.
| If you cannot find the answer you need, please go to Mech-Mind Online Community to post your questions in the Q&A category and exchange ideas. |
- Question overview
-
Step FAQs Fit Line to Surface Edge
Fit Circle to Surface Edge
Transform Surface
2D Alignment, Surface Alignment
What Is the Purpose of Filling Null Points?
Related Steps: Fit Line to Surface Edge, Fit Circle to Surface Edge
Null points are points in the surface data that lack depth or intensity information, which are usually caused by occlusion or data loss. Filling null points is usually performed at the profile level, which ensures the continuity of the profile data and makes the detection results more accurate. If null points are not filled, valid points adjacent to null points cannot be involved in the calculation, which may lead to detection inaccuracy.
In Mech-MSR, there are two ways to fill the null points:
-
Gap filling: Suitable for continuous null points (“gaps”) on the profiles. You can set the maximum gap width (mm) for filling through the Gap Filling Threshold parameter in the Step parameter panel. When the size of a gap is less than or equal to the set threshold, the nearest valid point from the lower side of the gap is used to fill it. When the gap size exceeds the set threshold, it remains as null point(s).
-
Fixed value filling: Fills null points with a specified depth value or intensity value. After selecting the Include Null Points parameter in the Step parameter panel, you can set a specific filling value.
The two methods can be used together.
Consequences of non-filling (taking the Fit Line to Surface Edge Step as an example for gap filling):
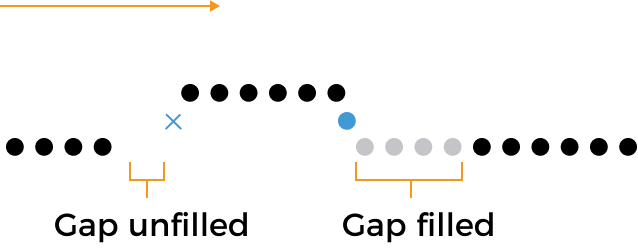
As shown in the figure, the black dots are valid points, the gray dots filled points, and the blue dot the detected edge point:
-
Left gap unfilled: The edge point at the rising step cannot be detected. If this is the case for multiple profiles, and the target edge is at the left-side steps, the line fitting is prone to deviation.
-
Right gap filled: The edge point at the falling step can be detected.
Why Is the Fitted Line Not on the Actual Surface?
Related Steps: Fit Line to Surface Edge, Fit Circle to Surface Edge
This is normal.
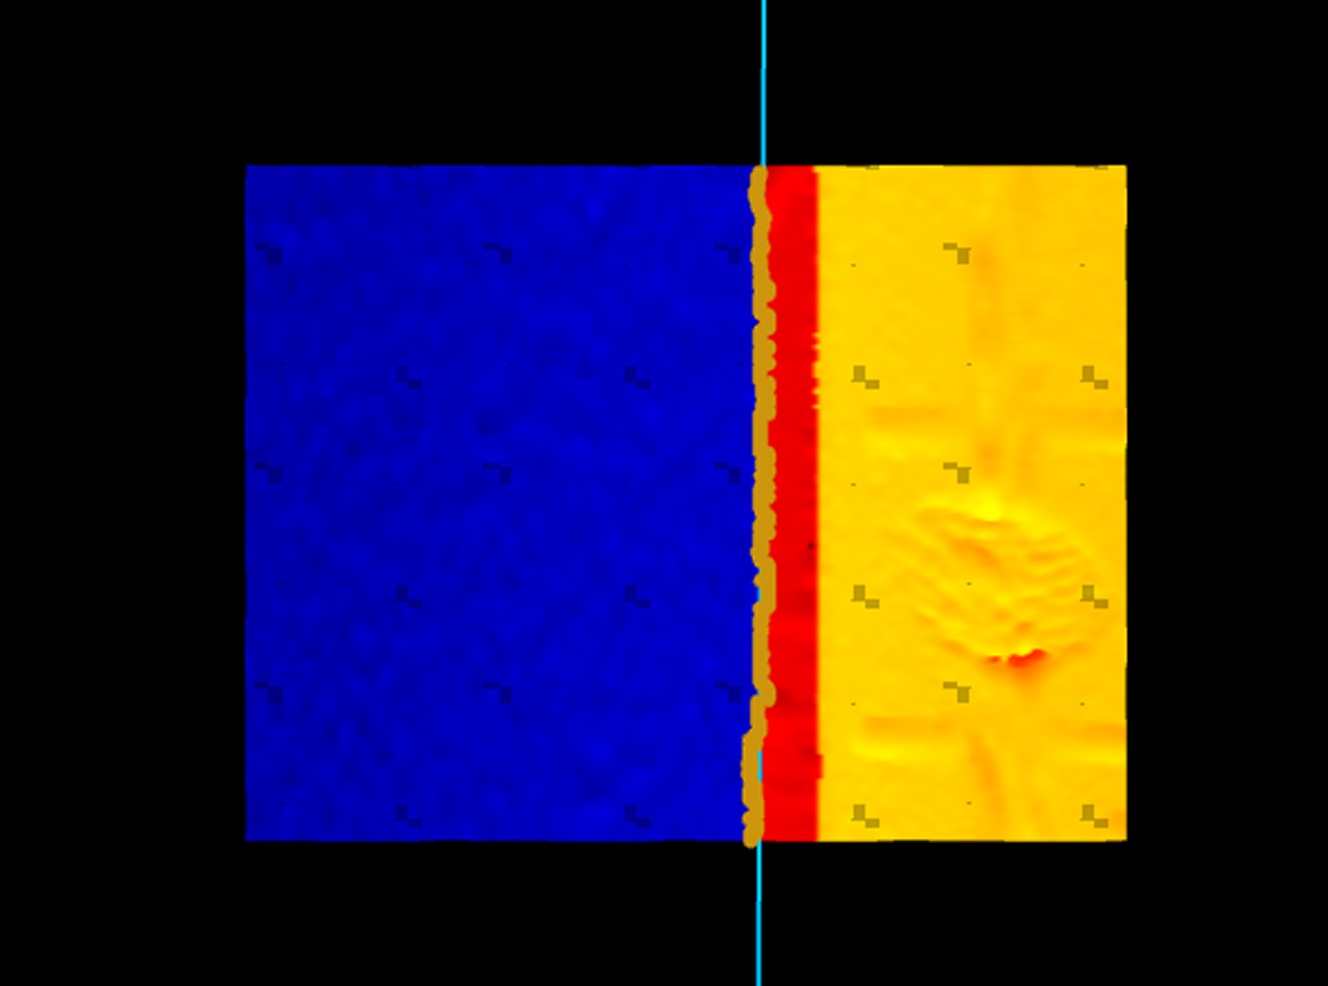
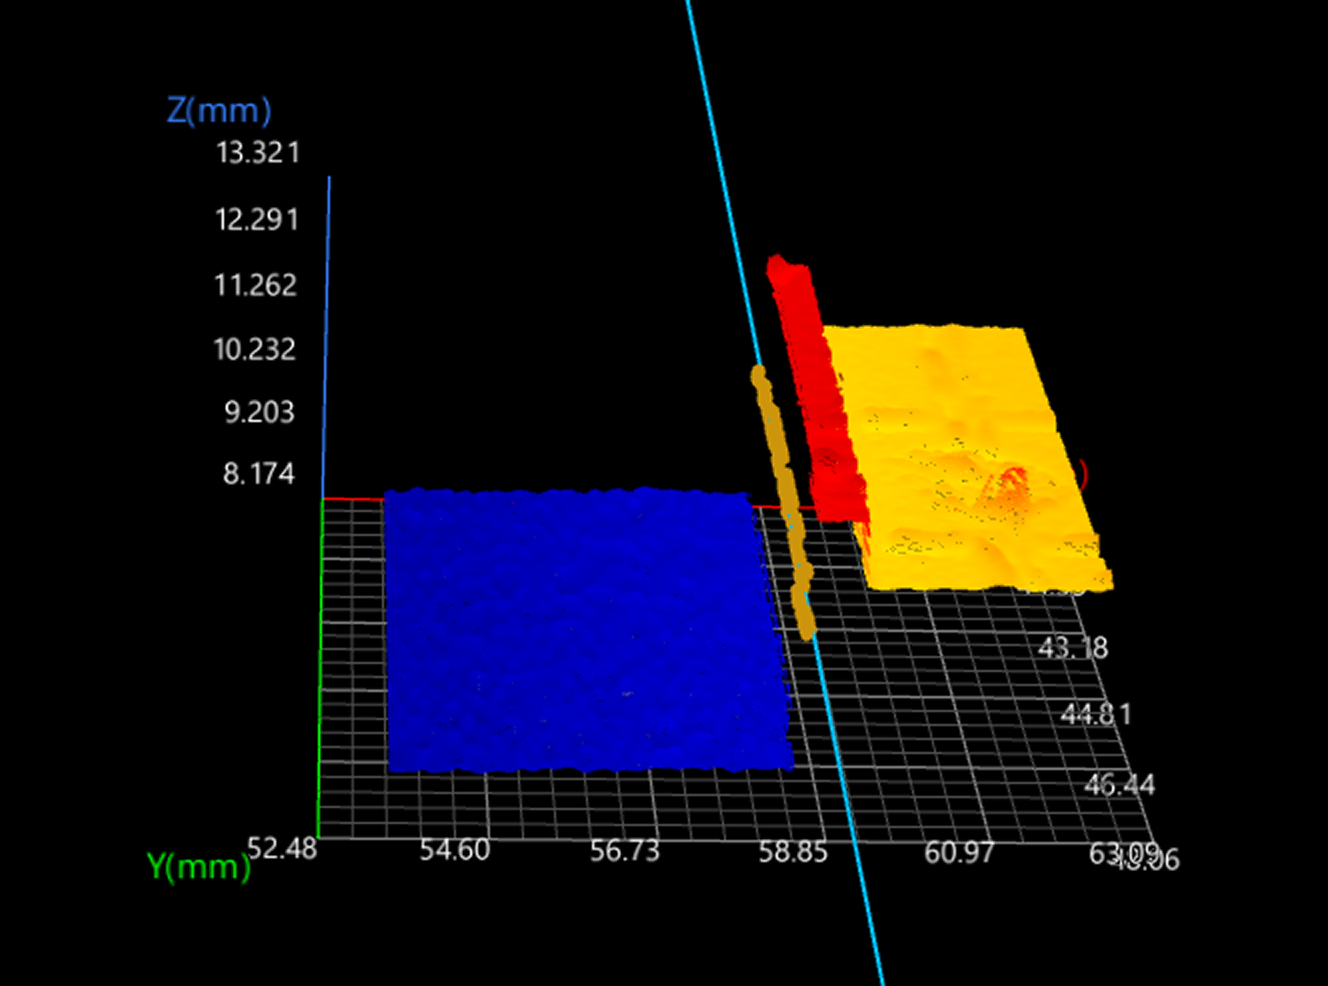
The phenomenon occurs only in Perspective mode; in Surface mode, the visualization is correct. The Z values of the fitted line or circle are usually of no reference significance. When measuring distances in the X or Y direction, the fact that the line or circle does not lie on the actual surface will not affect the measurement accuracy.
The line or circle is fitted on the basis of the detected edge points, and thus their Z values are determined by the Z values of those points. In the step mode, the edge points do not coincide with the actual edge but are computed as the points with the largest gradient change, usually located between two edges.
|
|
Surface mode |
Perspective mode |
Why Does the Caliper Length Appear to Remain Constant in the Data Visualization Window After Reaching a Particular Value?
Related Step: Fit Circle to Surface Edge
The caliper length is limited by the feature region’s side length, namely that it cannot exceed 90% of the feature region’s side length. When its value exceeds this limit, the effective value is automatically adjusted to 90% of the feature region’s side length.
The same holds if the feature region is not used. When the caliper length exceeds 90% of the shorter side of the image’s bounding box, the effective value is automatically adjusted to 90% of the shorter side of the image’s bounding box.
Why Do Transformed Surface Data Differ Greatly Despite Being Close in Position Within the Same Project?
Related Step: Transform Surface
If the original surface data are close in position but the transformed results differ significantly, it is important to check whether the directions of the input lines vary greatly. In the Transform Surface Step, the direction of the input line usually determines the positive direction of the X-axis in the new reference frame. If the input lines differ greatly in direction, the transformed surface data will also vary considerably.
The following example uses fitted lines output by the Fit Line to Surface Edge Step to show the effect of line direction:
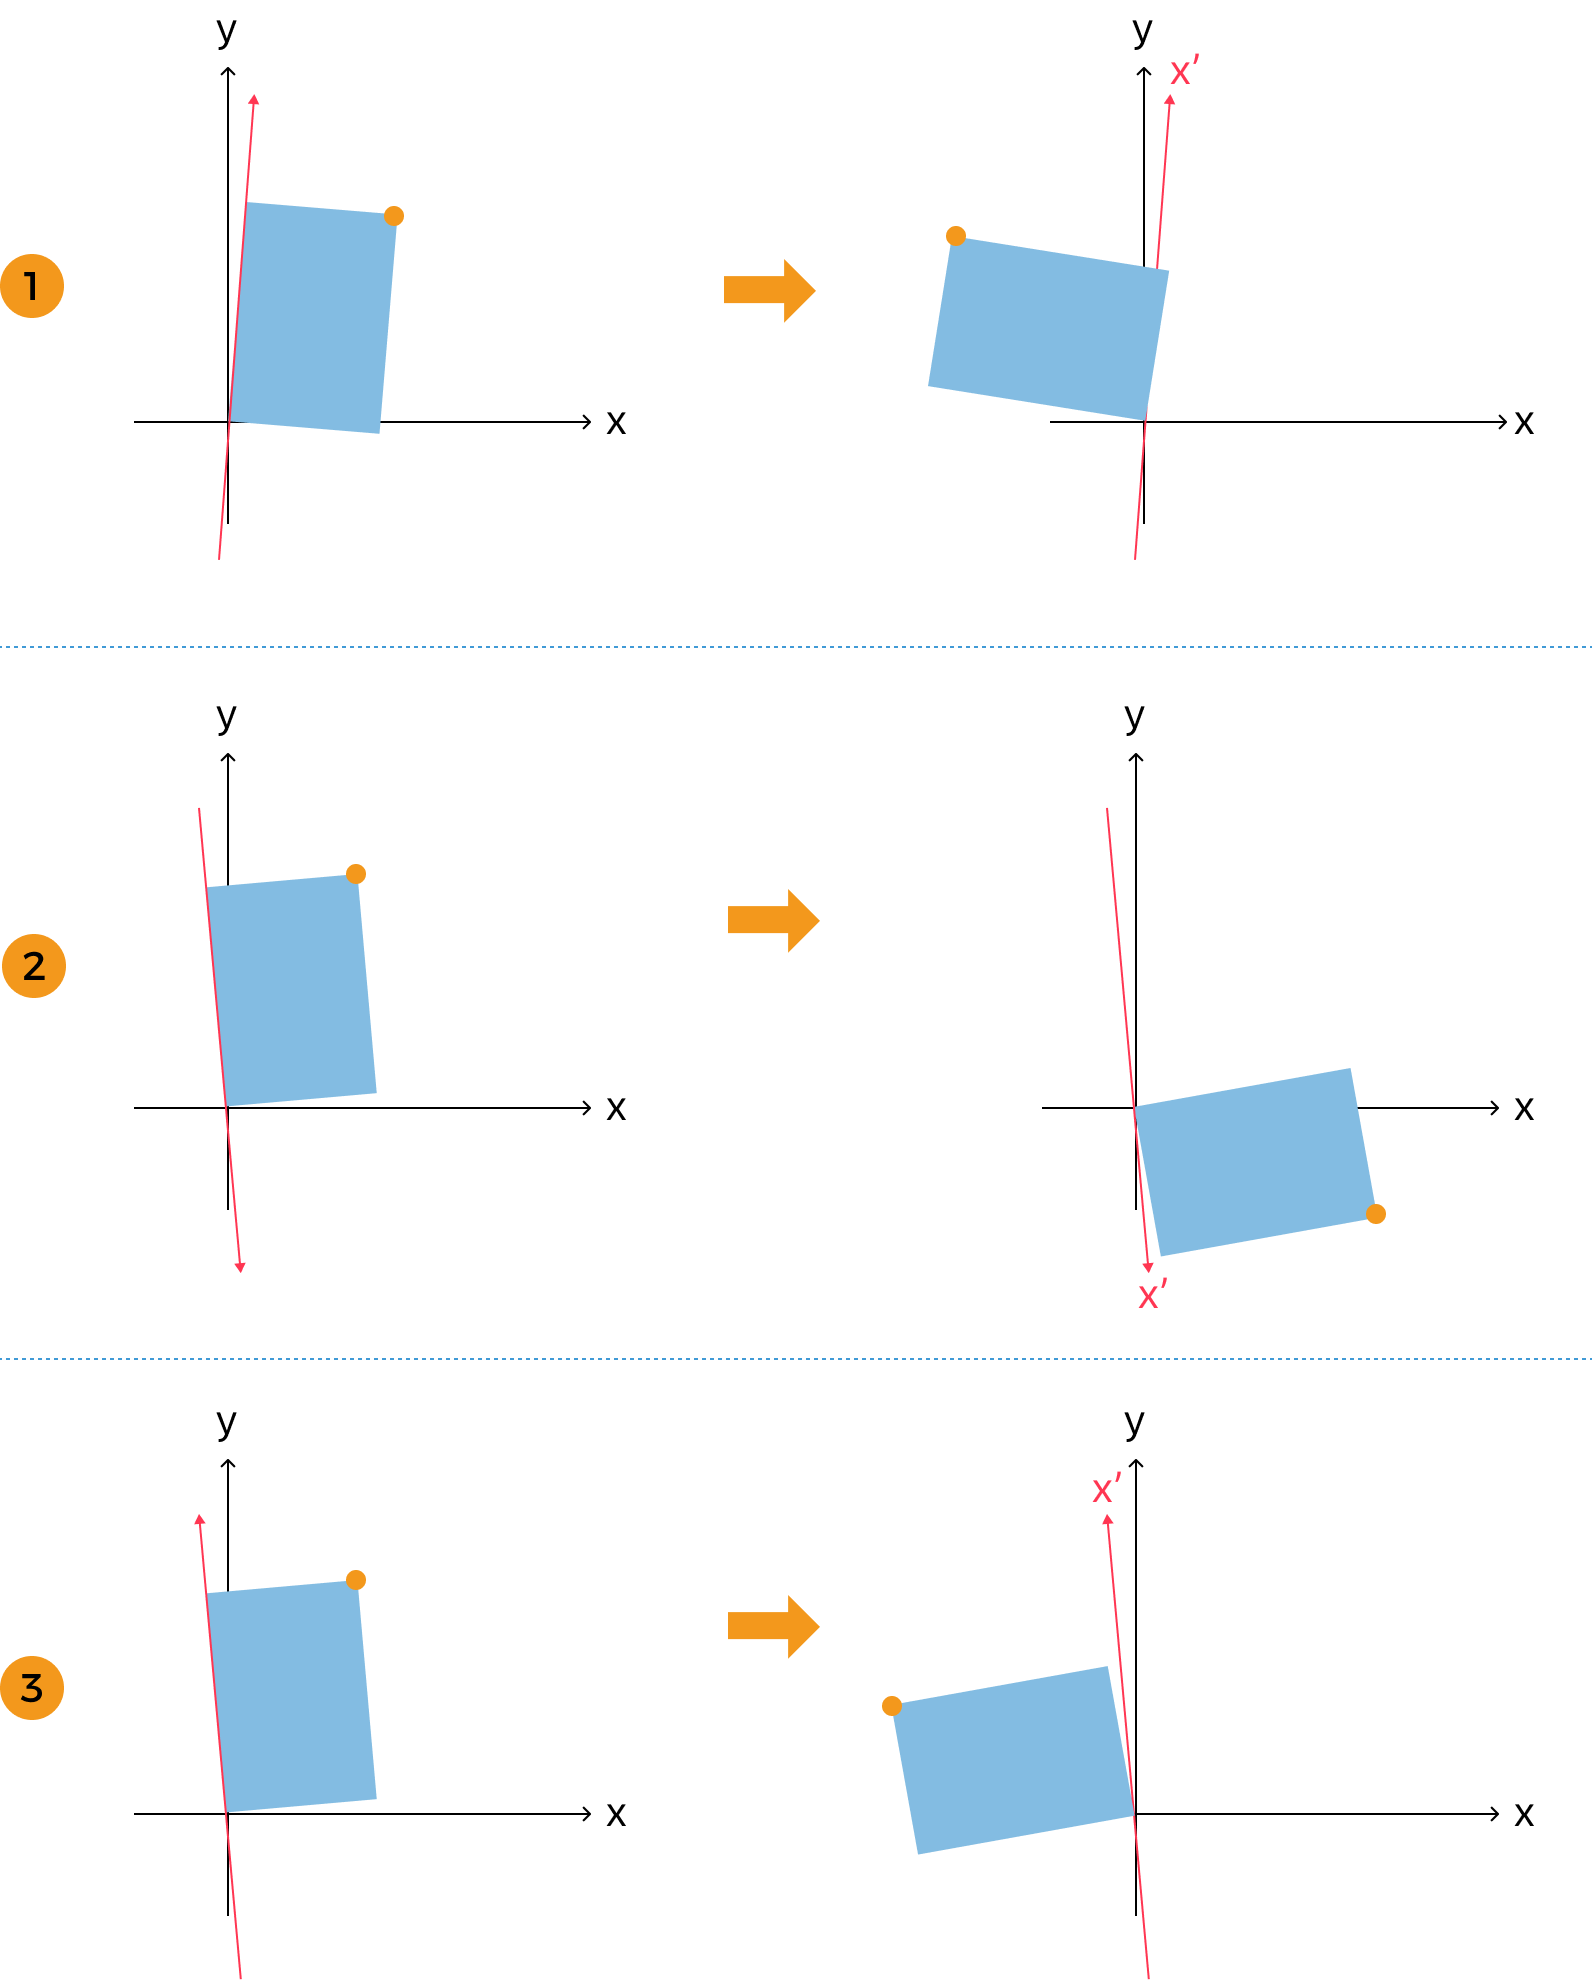
As shown in the figure below, in scenarios ① and ② (or ① and ③), the original surface data are very close, and thus the transformed results are expected to remain close as well. If the “Fitted Line Direction” parameter is set to Positive X, the directions of the fitted lines in the two scenarios differ greatly (see the red arrows in ① and ②). As a result, the positions of the transformed surface data show a noticeable difference. To make the transformed surface data closer so that the subsequent processing Steps are not affected, you can change the “Fitted Line Direction” parameter to Positive Y. In this case, the directions of the fitted lines in the two scenarios are close (see the red arrows in ① and ③), leading to closer transformation results.
Is It Normal for a Small Part of the Surface Data to Show a Decrease or Increase in Data Points After Surface Transformation?
Related Step: Transform Surface
This is normal.
Surface transformation is the process of converting the surface data into triangular mesh first, performing transformation according to the settings, and then resampling the data back into surface data. During resampling, a small part of the data may encounter a decrease or increase in data points, which is normal and generally has little influence on the measurement results.
If the decrease or increase in data points is severe and is likely to have a large impact on the measurement results, please contact Technical Support.
Is It Normal for There to Be a Positional Misalignment Between the Input and Output Images in the Data Visualization Window?
Related Steps: 2D Alignment, Surface Alignment
This is normal.
The template image offset is automatically set to 0 for the generated matching template, serving as the reference position for alignment. If the image input to the Step has an offset in the X or Y direction, it will be moved to the reference position after alignment to match the template. As a result, you may notice a positional misalignment between the input and output surface data of the Step when viewing both at the same time in the data visualization area.
Such positional misalignment does not affect the alignment result. The positional changes after image alignment are stored in the Alignment Parameter Group output of the Step, allowing subsequent Steps to use this information and ensuring consistency throughout the measurement process.