Show Point Clouds and Poses
Function
Display Point Clouds and Poses.
|
Comparison of Similar Steps The Step Show Point Clouds and Poses is used to show point clouds and poses while the Step Show Images is used to show color images and masks. |
Usage Scenario
This Step can display the relative position between the point cloud(s) and pose(s). For example, in a picking application, it can be used to check if the poses are correct. It is usually used in debugging phase.
Input and Output
Input
| Input port | Data type | Description |
|---|---|---|
Point Clouds Shown in White |
PointCloud/XYZNormal[] |
The point clouds input by this port will be displayed in white. |
Point Clouds Shown in Color |
PointCloud/XYZNormal[] - |
The point clouds input by this port will be displayed in a random color. |
Poses |
Pose[] - |
Poses to display. |
Parameter Description
Normal Vector Visualization Settings
| Parameter | Description |
|---|---|
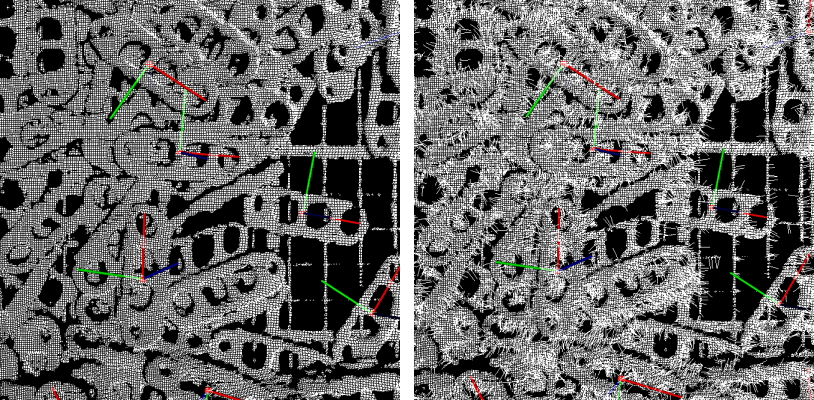
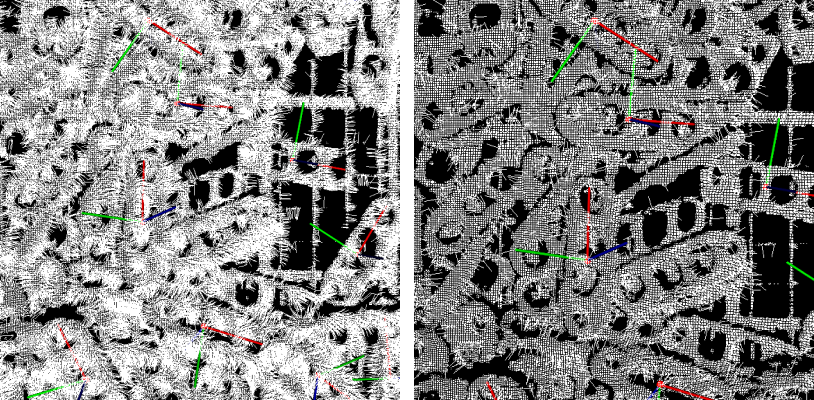
Show Normals |
Description: Select to show normals of the point cloud.
|
Display Interval of Normals |
Description: This option will only be available when the checkbox of Show Normals is selected.
|
Z Value Visualization Settings |
Description: Select to display the point clouds in different grayscales according to the Z value.
|
Upper Bound |
Description: Maximum Z value of point clouds to be colored. This option will only be available when the checkbox of Z Value Visualization Settings is selected.
|
Lower Bound |
Description: Minimum Z value of point clouds to be colored. This option will only be available when the checkbox of Z Value Visualization Settings is selected.
|