Run Steps and View Outputs
The successful functioning of an individual Step is the basis of the successful functioning of the entire project. This section will show you how to run the Step and use the debug output feature to check the performance of the Step.
Run the Step
-
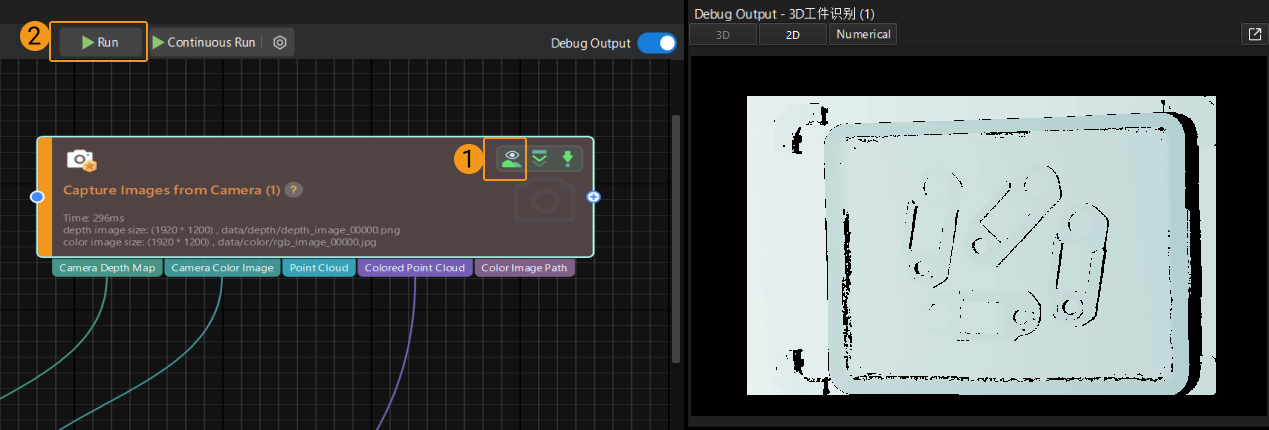
Clicking Run in the Project toolbar will run the entire project.

-
Click
 to run the current Step independently.
|
After running the Step, you can view the execution speed on the Step block. For example, Time: 66 ms. |
|
For the non-deep learning Steps, the graphics card specifications of the IPC are unrelated to the execution speed of the Steps. The execution speed of non-deep learning Steps is related to CPU multi-core performance (as indicated by CPU benchmarks). Upgrading the CPU specifications helps improve the execution speed of non-deep learning Steps. |
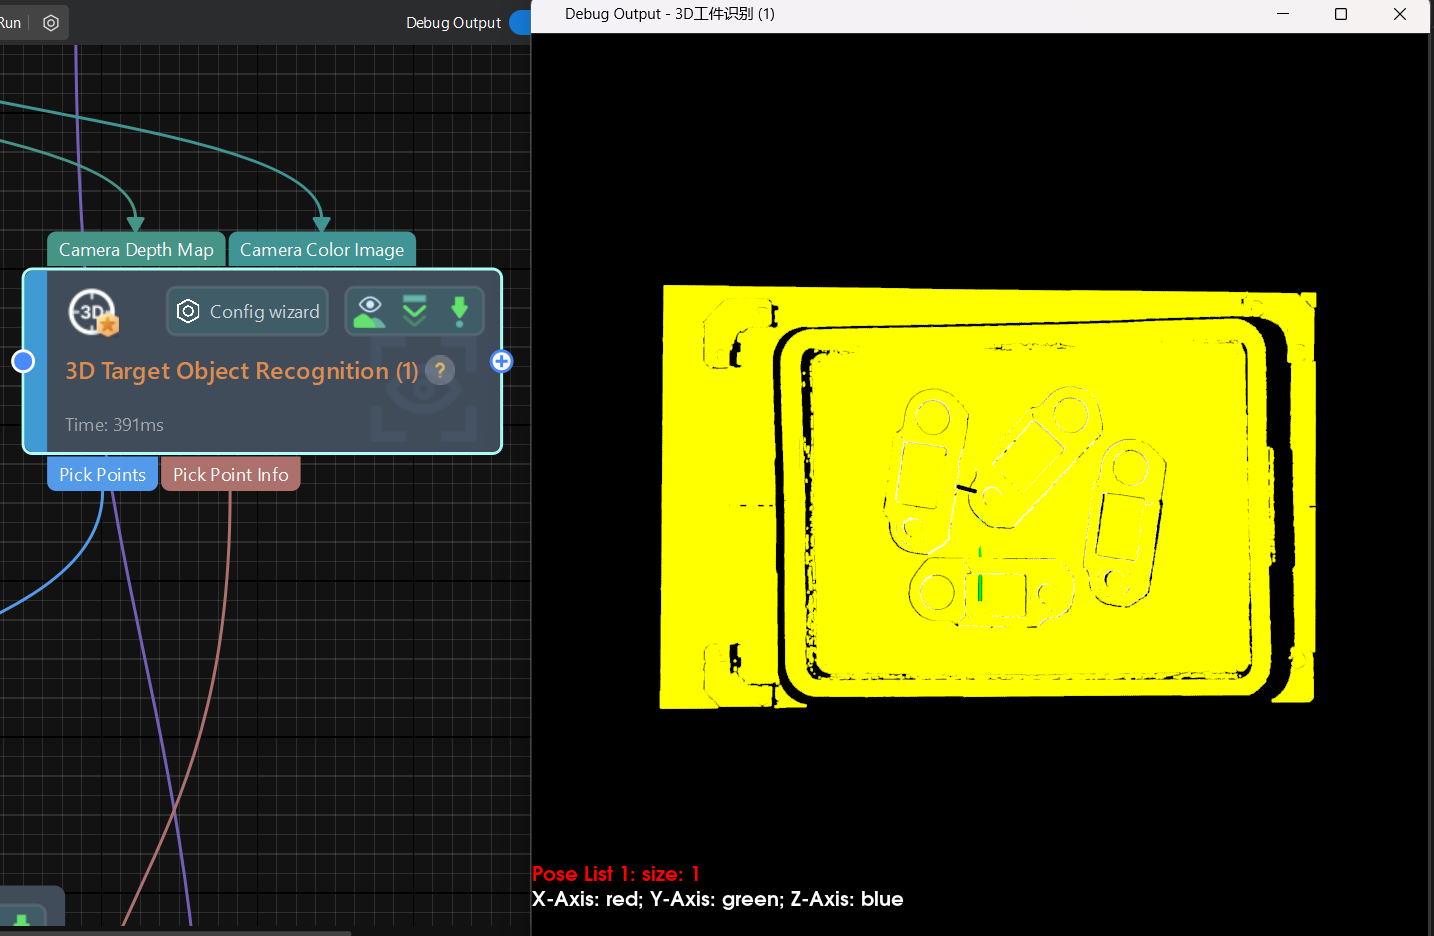
Debug Output
As an integral part of Mech-Vision, the debug output panel is where you can view the visualized output.
When debugging the project, the debug output feature enables users to visualize the output of the current Step.
Interface Introduction
In Mech-Vision, the debug output panel is located in the upper right corner of the main interface, as shown below.
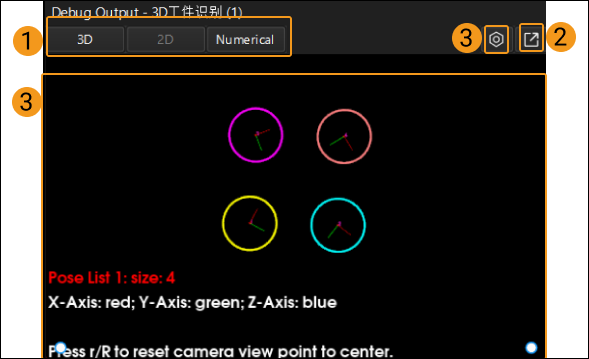
Interface description:
-
The data type of the output will be shown in 1.
-
Click 2 will make the panel pop up and turn it into an individual window.
-
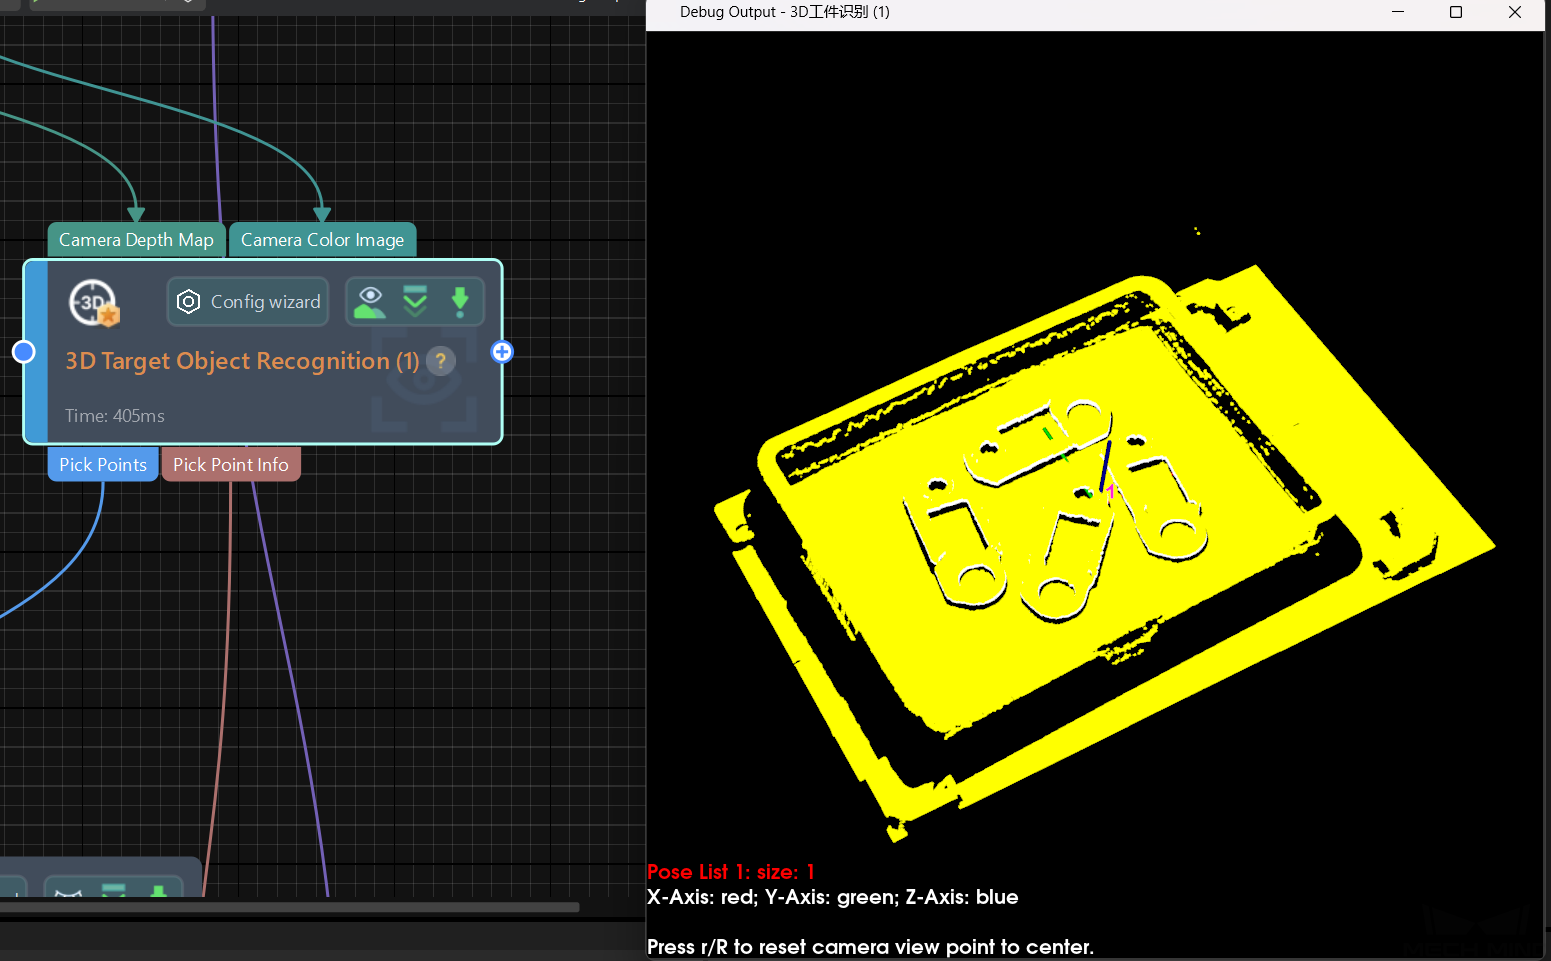
Click 3 to set the display size of the axes of poses and the world reference frame (only in the “3D Target Object Recognition” Step).
-
The visualized output will be displayed in 4.
Instructions
View the output of an individual Step
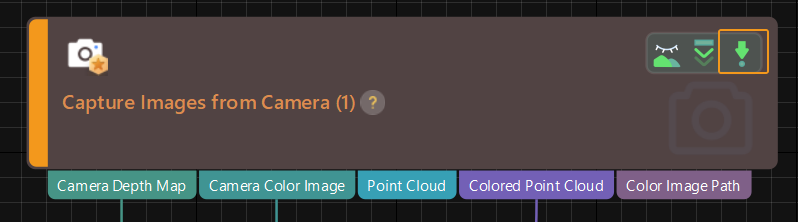
The Debug Output button in the project’s toolbar is already enabled by default. You also need to enable the “Can visualize output” icon for the corresponding Steps by clicking the ![]() button on the right side of the Step to turn it into
button on the right side of the Step to turn it into ![]() . Then click the Run button to quickly view the visualized outputs of the Steps in the debug output panel.
. Then click the Run button to quickly view the visualized outputs of the Steps in the debug output panel.
View outputs of multiple executions of an individual Step
To view the visualized outputs of multiple executions of a specified Step, please select the Step first and then click ![]() in the Debug Output window to pop up the individual debug output window. Click Run and you can view the visualized outputs of multiple executions of the selected Step in the individual debug output window.
in the Debug Output window to pop up the individual debug output window. Click Run and you can view the visualized outputs of multiple executions of the selected Step in the individual debug output window.
|
If you need to view multiple visualized outputs of multiple Steps, please follow the above instruction and open multiple individual debug output windows. |