View Raw Data
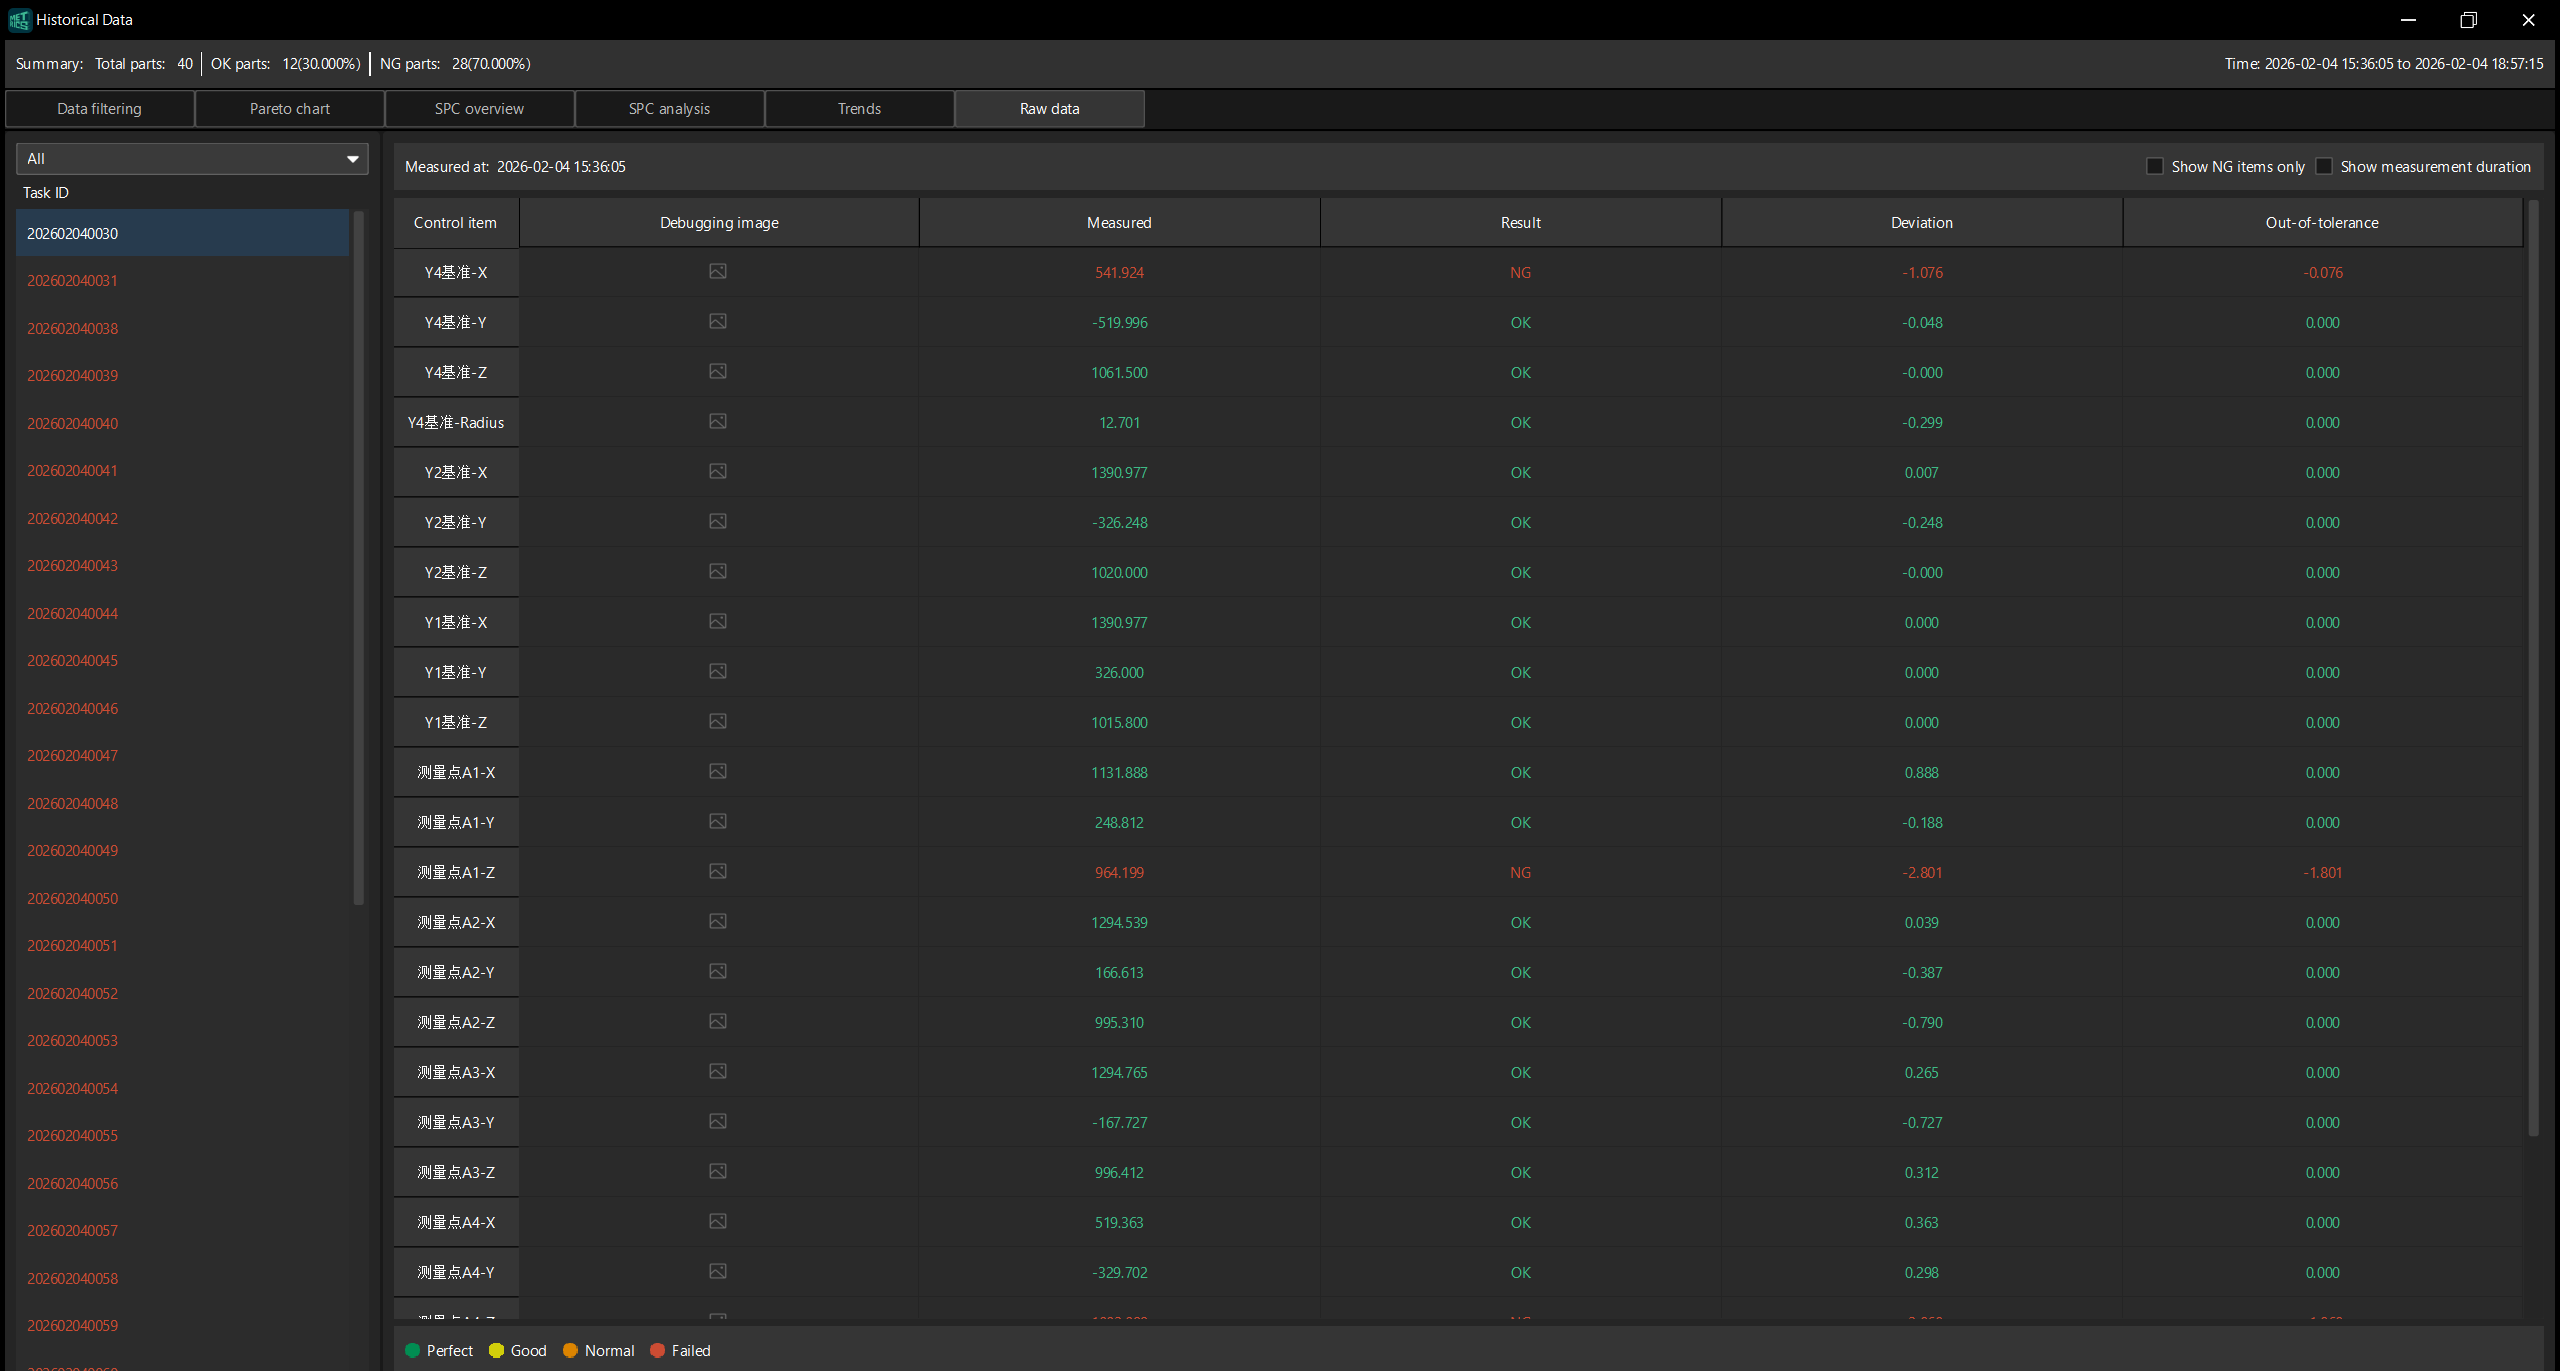
The Raw Data page displays the detailed measurement data of each control item in all measurement tasks, facilitating you to view and check the measurement results one by one.
Before viewing the raw data, please complete the following actions:
-
In the upper ribbon, select .
-
In the Data filtering tab, complete data filtering and select measurement records. For details, refer to Filter, View, and Export Historical Data.
-
Click the Raw data tab at the top of the page.
Task List
The Task ID list is displayed on the left of the page. The drop-down list at the top allows you to filter the displayed task ranges (such as all tasks).
Click a task ID, and the detailed measurement data of this task will be displayed in the data table on the right.
Data Sheet
The data table on the right of the page displays the measurement data of the selected task, and the measurement time is displayed at the top. The data table includes the following columns:
| Column name | Description |
|---|---|
Control item |
The name of the measurement control item (such as Y4 Criterion-X, Y4 Criterion-Y, Y2 Criterion-Z, Measurement Points A1-X, etc.). |
Debugging image |
Click the icon to view the debugging image corresponding to this control item. |
Measured |
The actual measured value of this control item. |
Result |
The measurement result of this control item, displayed as OK or NG. |
Deviation |
The deviation between the measured value and the nominal value. |
Out-of-tolerance |
The difference between the measured value and the tolerance range. Only displayed when the measurement result is NG. |
The following filtering options are available in the upper right corner of the page:
-
Show NG items only: Select to show only the control items whose measurement results are NG.
-
Show measurement duration: Select to show the measurement duration of each control item in the data table.
Data Color Description
The raw data page displays the measurement data in different colors to facilitate quick recognition of data quality:
-
Perfect (green): The measured value is within the best range.
-
Good (yellow): The measured value is within a good range.
-
Normal (orange): The measured value is within the acceptable range.
-
Failed (red): The measured value is outside the tolerance range.