View Trend Charts
This section introduces how to view and use the trend chart analysis feature.
|
Before viewing the trend chart, please complete the following actions:
-
In the upper ribbon, select .
-
In the Data filtering tab, complete data filtering and select measurement records. For details, refer to Filter, View, and Export Historical Data.
-
Click the Trends tab at the top of the page.
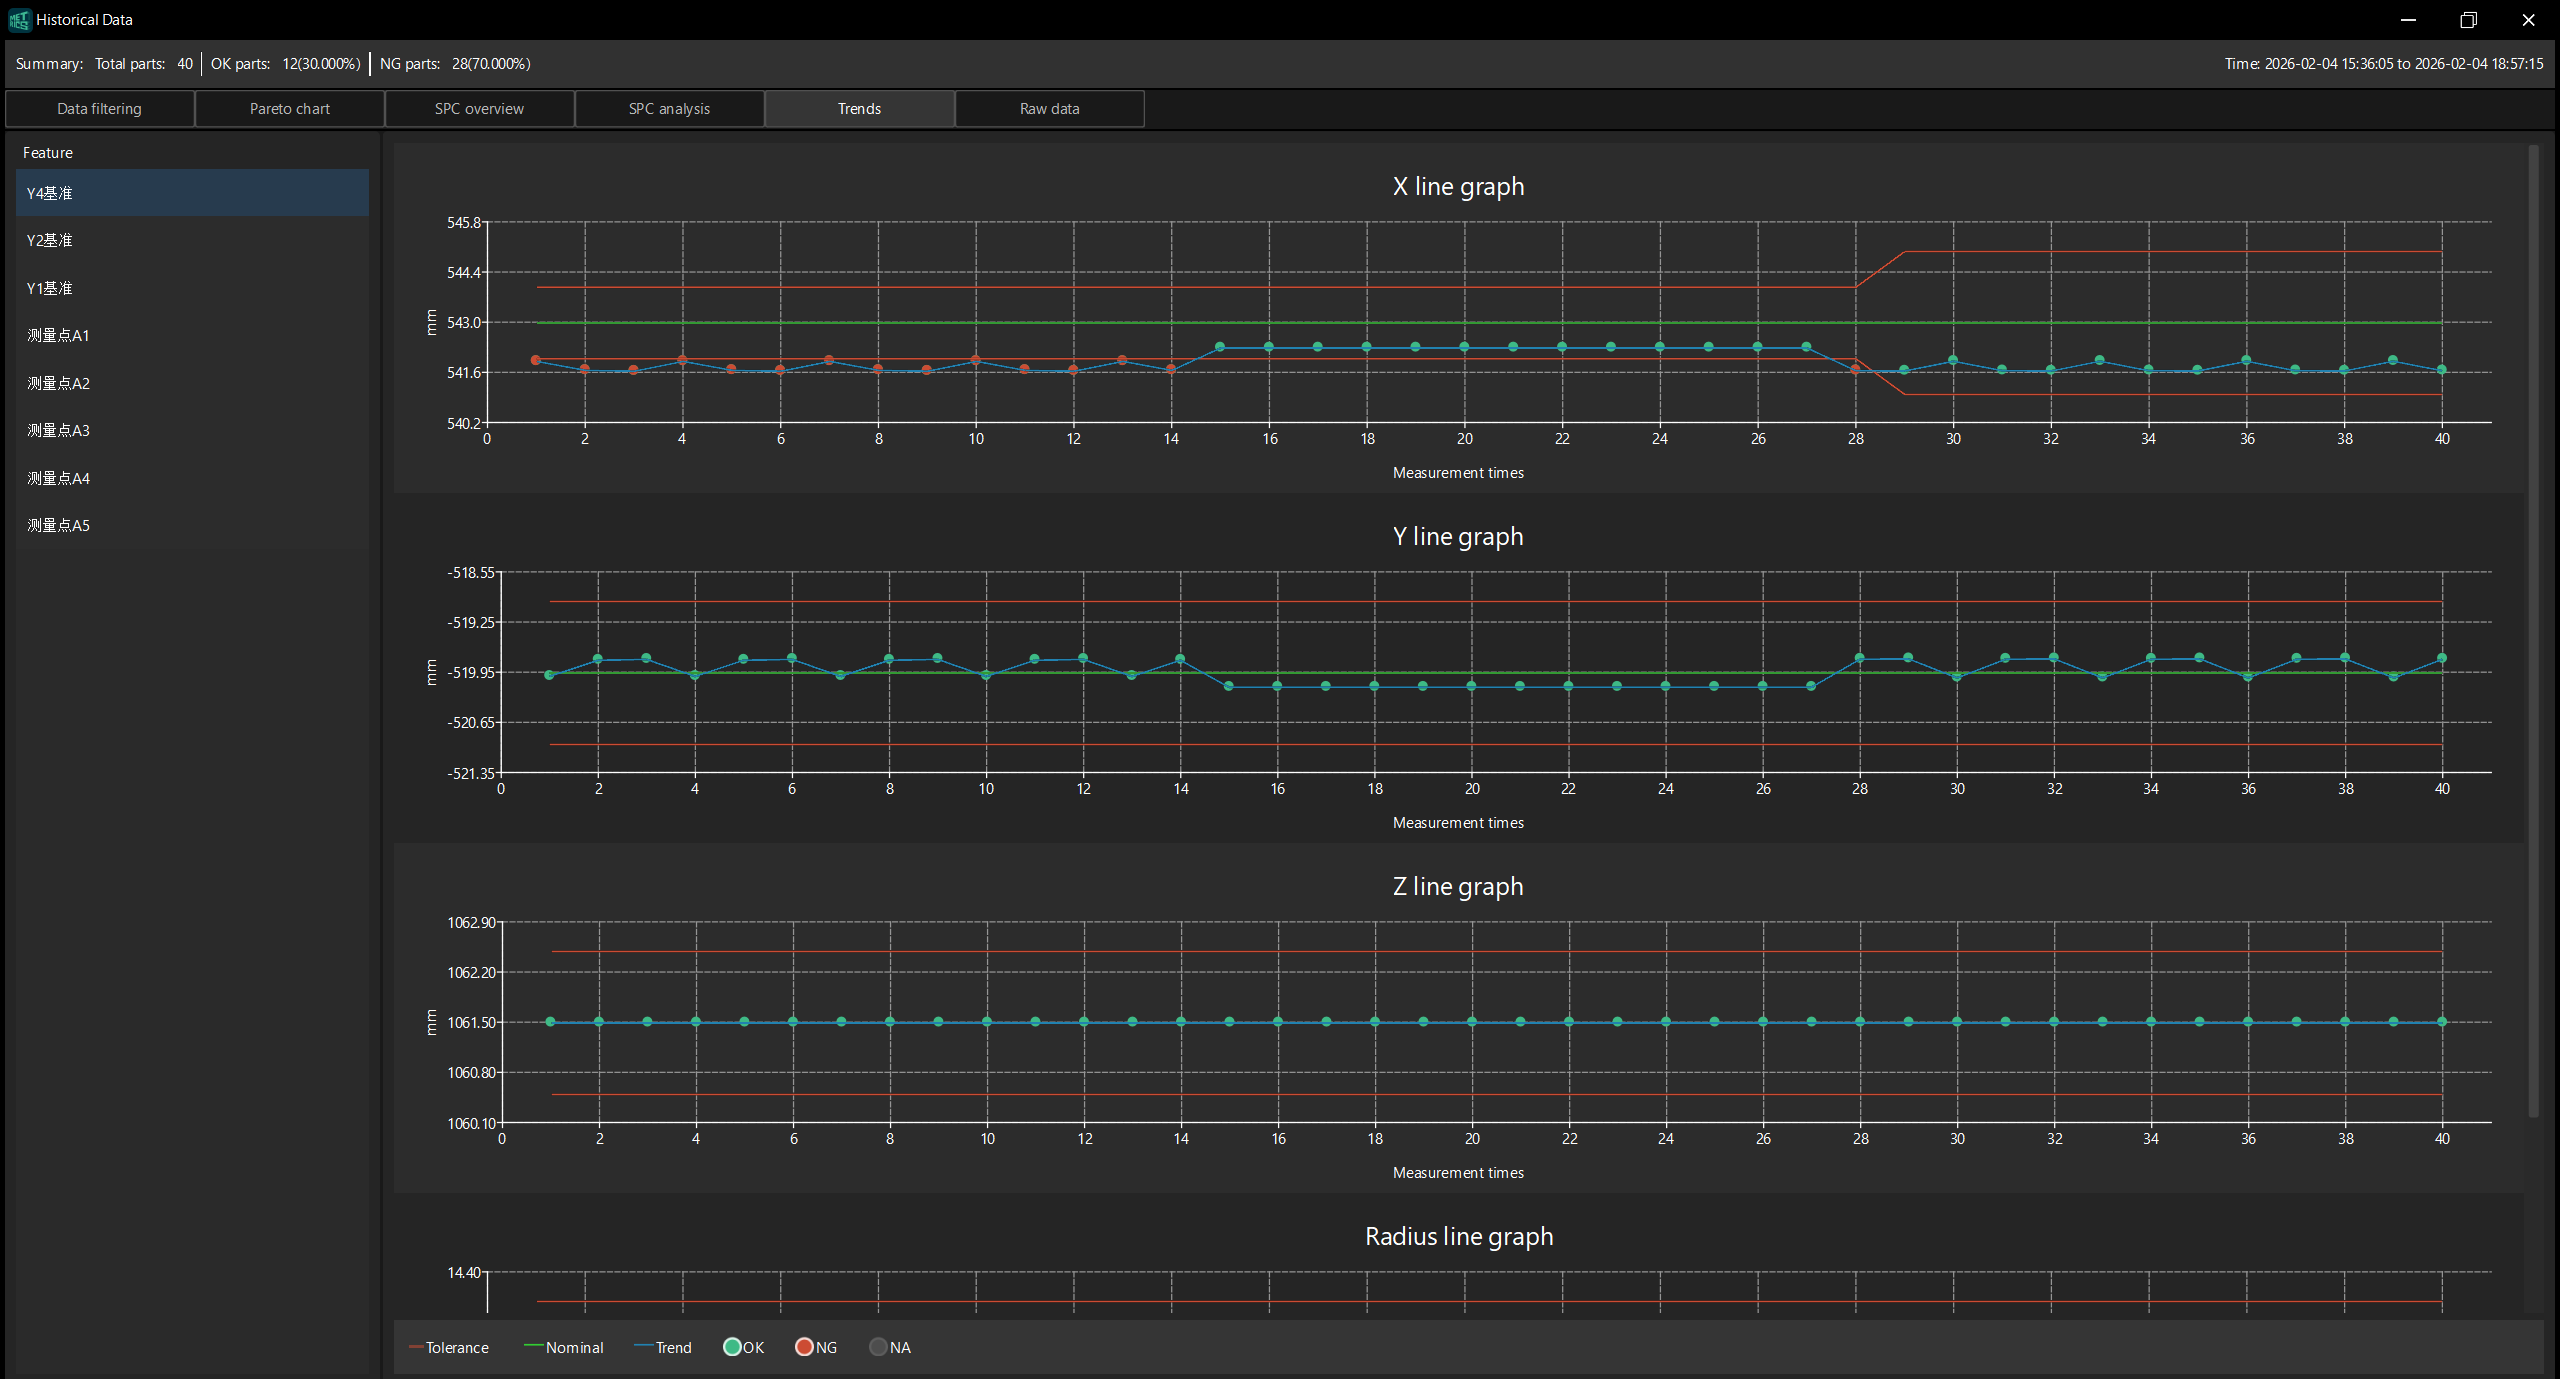
Measurement Feature List
The left panel on the page displays a list of measurement features, which lists all the measurement features of the current part, such as Y4 reference, Y2 reference, Y1 reference, and measurement points A1 to A5.
Click a measurement feature, and the right panel displays the trend line graphs of each measurement sub-item (such as X, Y, Z, Radius).
Line Graph Contents
Each measurement sub-item is displayed in an individual line graph. The horizontal axis is measurement times, and the vertical axis is the measured value. The figure contains the following elements:
-
Tolerance (red line): Upper and lower tolerance limits. If the measured value exceeds this range, it is unqualified.
-
Nominal (green line): the nominal value of the measurement sub-item.
-
Trend (blue line): Connect the measured values for each measurement to show the trend of data changes.
Data points mark measurement results in different colors:
-
OK (green dot): The measurement result is qualified.
-
NG (red dot): The measurement result is unqualified.
-
NA (gray dot): No measurement result.
|
Hover the cursor over a data point in the line graph to view the specific data of that point, such as measurement task, measurement time, nominal value, and measured value. |