View Pareto Chart
This section introduces how to view and use the Pareto chart analysis feature.
|
Before viewing the Pareto chart, please complete the following actions:
-
In the upper ribbon, select .
-
In the Data filtering tab, complete data filtering and select measurement records. For details, refer to Filter and View Historical Data.
-
Click the Pareto chart tab at the top of the page.
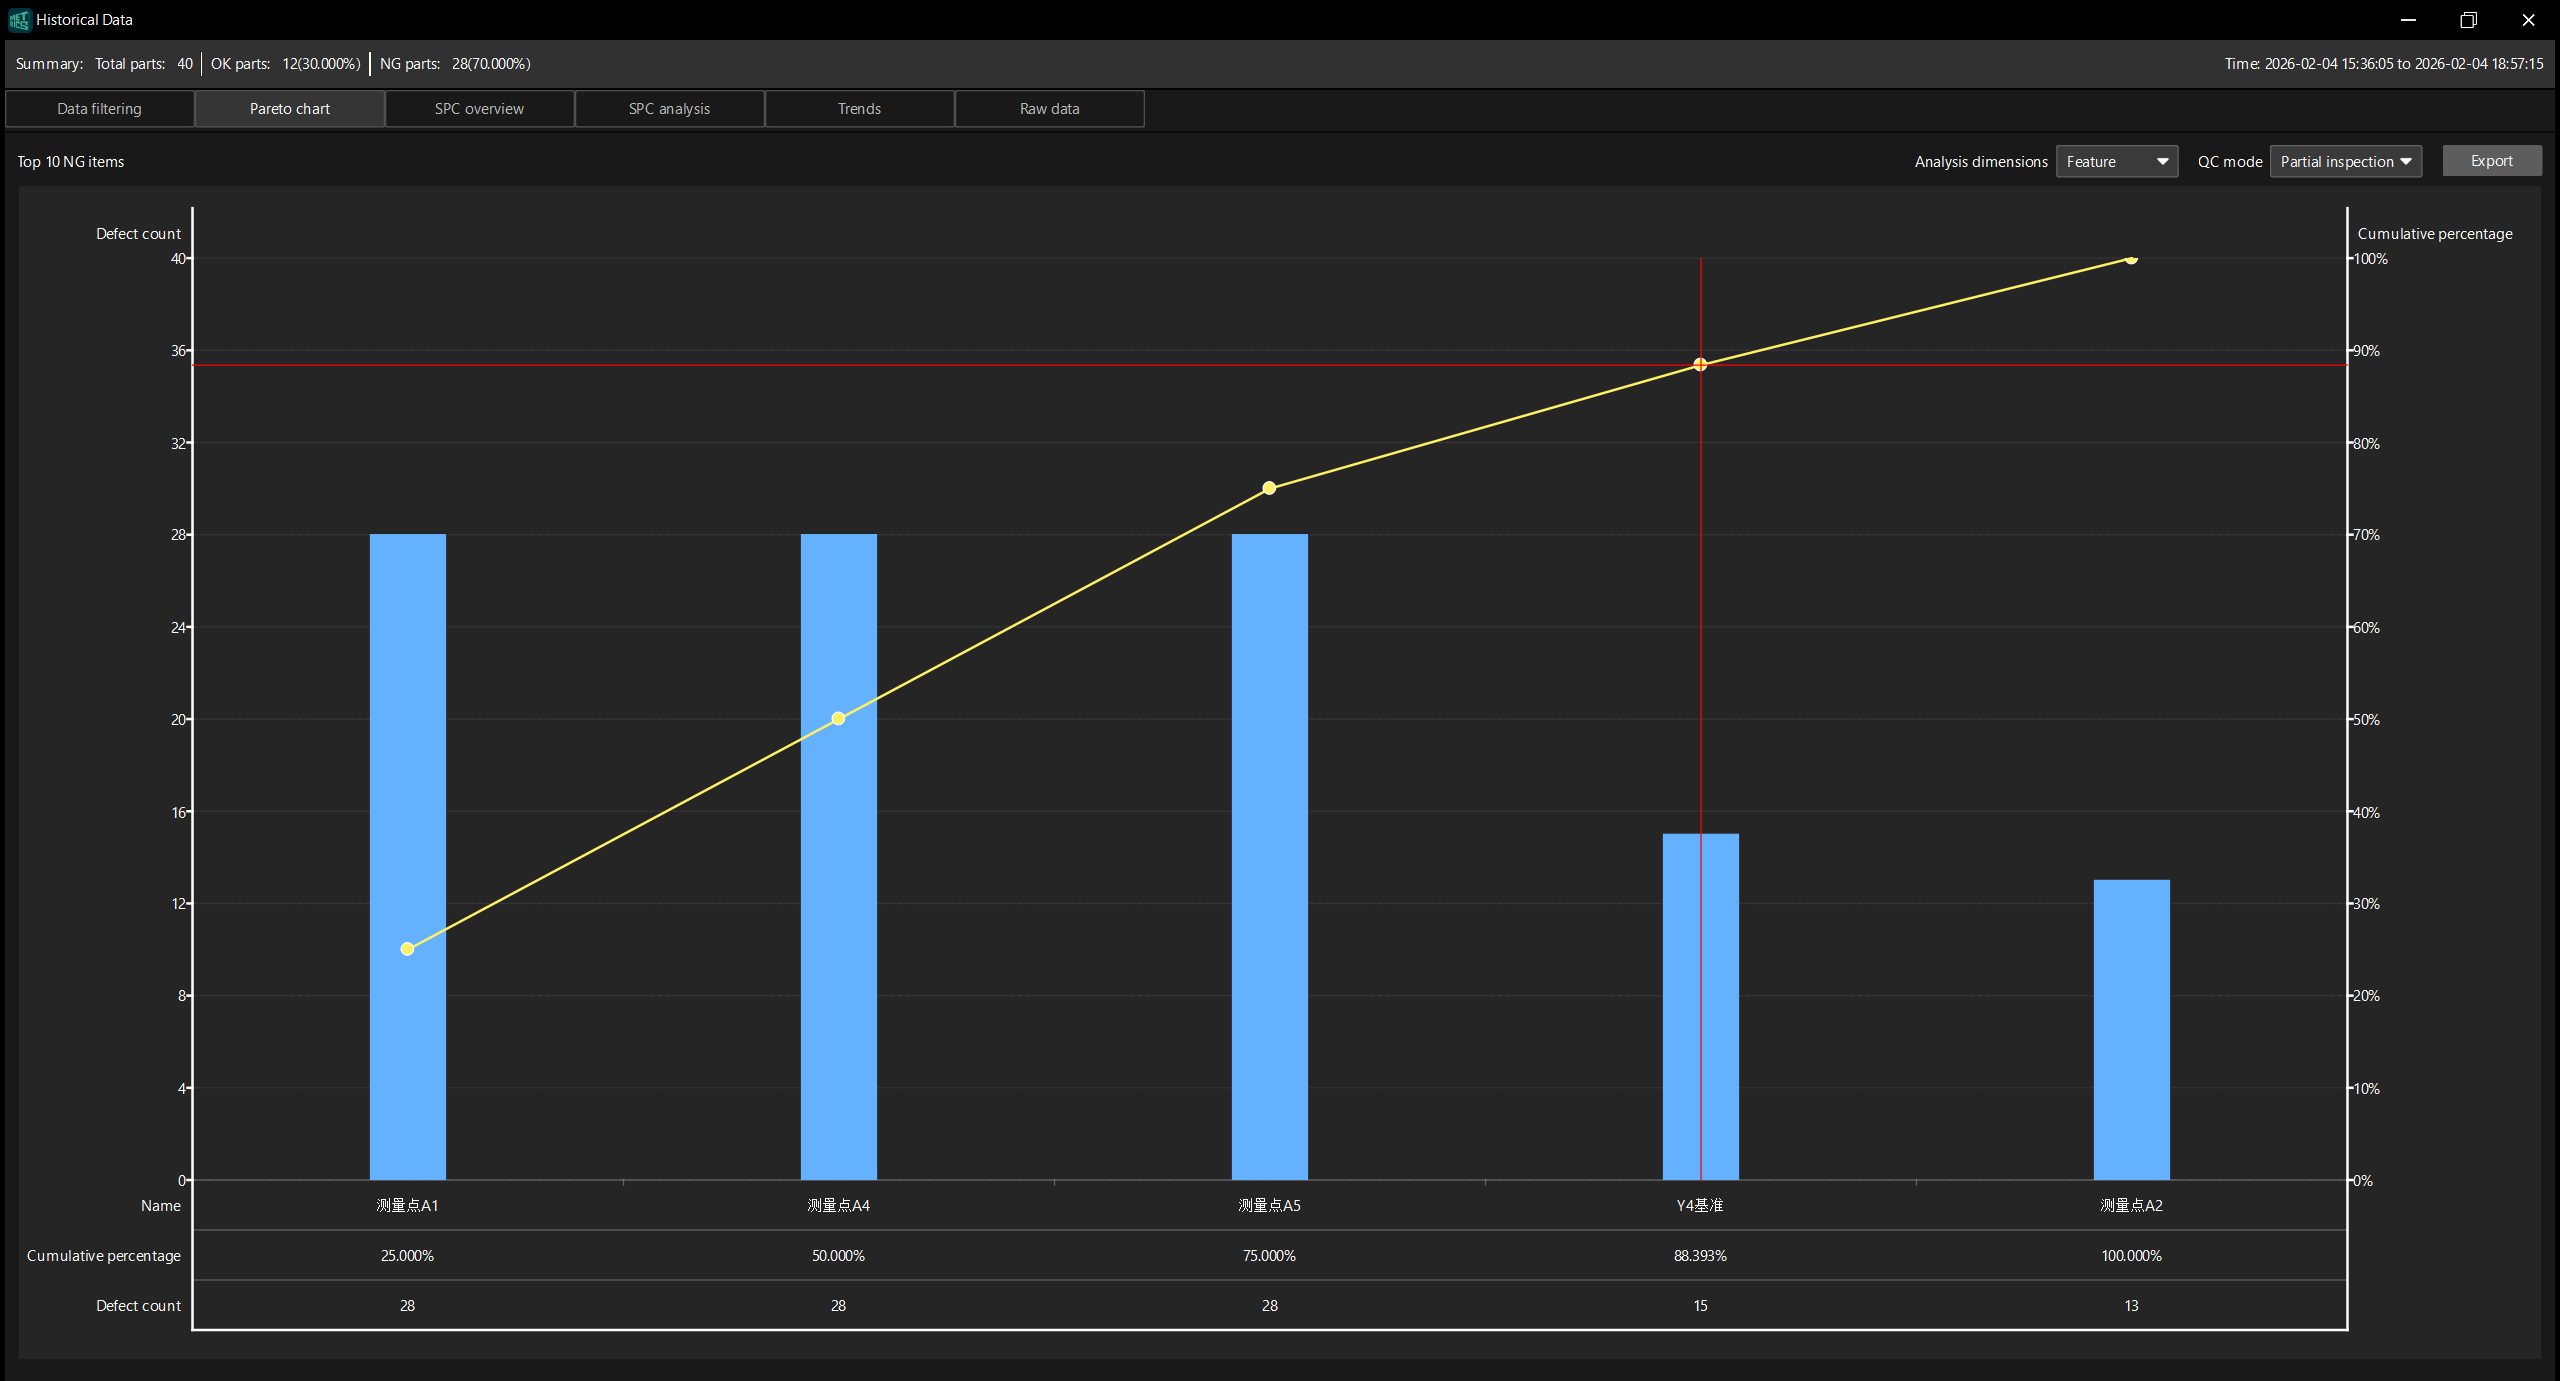
Chart Settings
The upper right corner of the page provides the following settings:
-
Analysis dimensions: Select the dimension for analysis and select Control item or Feature.
-
When Control item is selected, the Pareto chart will display the defect data by the dimension of the control item.
-
When Feature is selected, an additional QC mode option will be displayed.
-
-
QC mode (displayed only when Feature is selected in the analysis dimensions): Select the quality inspection mode, either Partial inspection or Full inspection.
Chart Content
A Pareto chart displays the following information:
-
Blue bar chart (left: Defect count): Sort the defects in descending order of the number of defects to visualize the number of defects.
-
Yellow line (right: Cumulative percentage): Displays the cumulative percentage of the number of defects of each non-compliant item, which is used to identify the major defect items.
-
Red vertical line: marks the dividing line where the cumulative percentage reaches a certain threshold, dividing the undesirable items into major and minor factors.
The bottom of the chart displays the detailed data of each undesirable item:
-
Name: The name of the undesirable item (such as measurement point A1, measurement point A4, etc.).
-
Cumulative percentage: The cumulative percentage of the number of defects of this defect item and all preceding items relative to the total number of defects.
-
Defect count: The number of defects of this defect item.