Encoder and Input Signal Viewer
This tool is used to view the signals input to the laser profiler from the encoder and other external devices, check if the signals are input correctly, and verify the input timing and duration of logic signals, etc.
|
Available models:
|
Start the Feature
You can click Tools > Encoder and Input Signal Viewer in the menu bar to open the tool.
Please refer to the corresponding section below according to the device model you are using.
LNX-7000 Series
This section applies to the LNX-7000 series (integrated laser profiler).
In Mech-Eye Viewer, this tool provides the following two modes:
-
Online Monitoring: Connect to the laser profiler and view the encoder and input signals acquired by the laser profiler in real time. This mode is suitable for on-site monitoring of current device signals in real time.
-
Offline Playback: Load the local acquisition file and playback the encoder and input signal data acquired during history. No need to connect to the laser profiler. This option is suitable for historical signal recapping and troubleshooting.
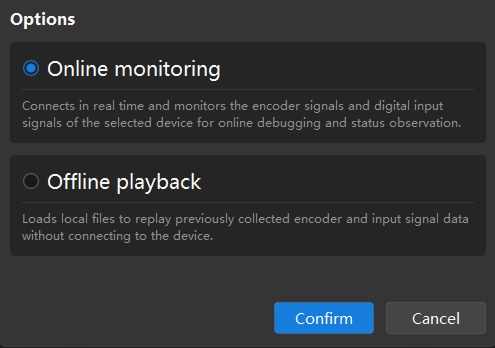
After entering the tool, select the mode (Online Monitoring or Offline Playback) in the pop-up window, and then click OK to enter the corresponding mode.
Online Monitoring
Follow these steps to monitor the encoder and input signals online:
-
Confirm that the signal cables are correctly connected to the corresponding signal terminals of the laser profiler.
-
After entering the Online Monitoring mode, select the laser profiler in the Device List on the right and check the device information (such as serial number, model, and IP address).
-
Set Signal Collection Period and time unit, and set the storage path according to actual needs.
-
In the right Display Settings, enable the Display Frame Acquisition Range and Caliper Tool function as needed.
-
Click the Start Collection button to start acquiring signals.
-
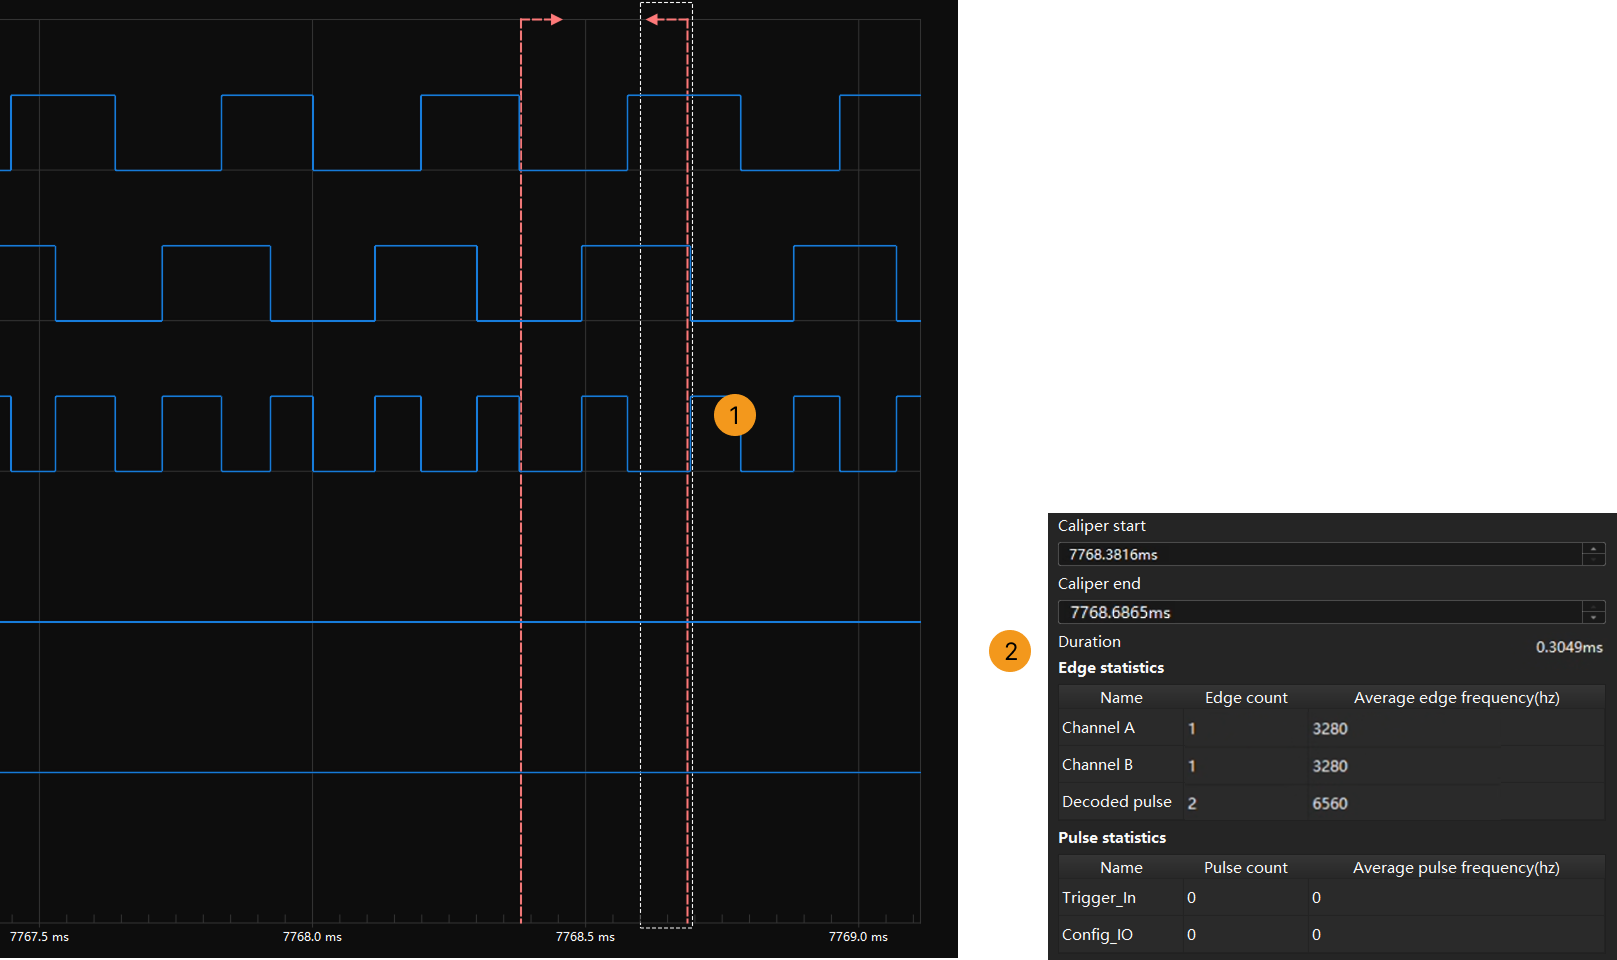
Check the signals in the waveform display area on the left. The horizontal axis, representing time, helps determine the input timing of signals and the duration of logic signals.
There are two types of signals:
-
Encoder signals: Channel A, Channel B, Decoded Pulse.
-
I/O signals: Trigger_In and Config_IO.
The meanings of signal waveforms are as follows:
Category Name Description Encoder signals
Channel A
Encoder A signal, which is used with channel B to detect the motion position and direction.
Channel B
Encoder B signal, which is used with channel A to detect the motion position and direction.
Decoded Pulse
Pulse signals generated after decoding channel A and channel B signals. These signals represent the motion and position of the encoder.
I/O signals
Trigger_In
External trigger signal for triggering the laser profiler to acquire data.
Config_IO
The I/O signals can be configured as inputs or outputs according to actual needs.
-
-
If the Caliper Tool is already enabled, after acquisition, you can drag the left or right caliper to select the time period to be analyzed and view the statistics:
|
Offline playback
Follow these steps to play back the encoder and input signals offline:
-
Click Importto load local acquisition file on the right File List.
-
Set the following parameters according to your needs:
-
Settings Overfrequency Range (default value: 8000 Hz) for filtering waveforms with frequencies exceeding this value.
-
Set Trigger Interval, the number of trigger signals needed for scanning one line.
-
Enable Display Frame Capture Range and Caliper Tool.
-
-
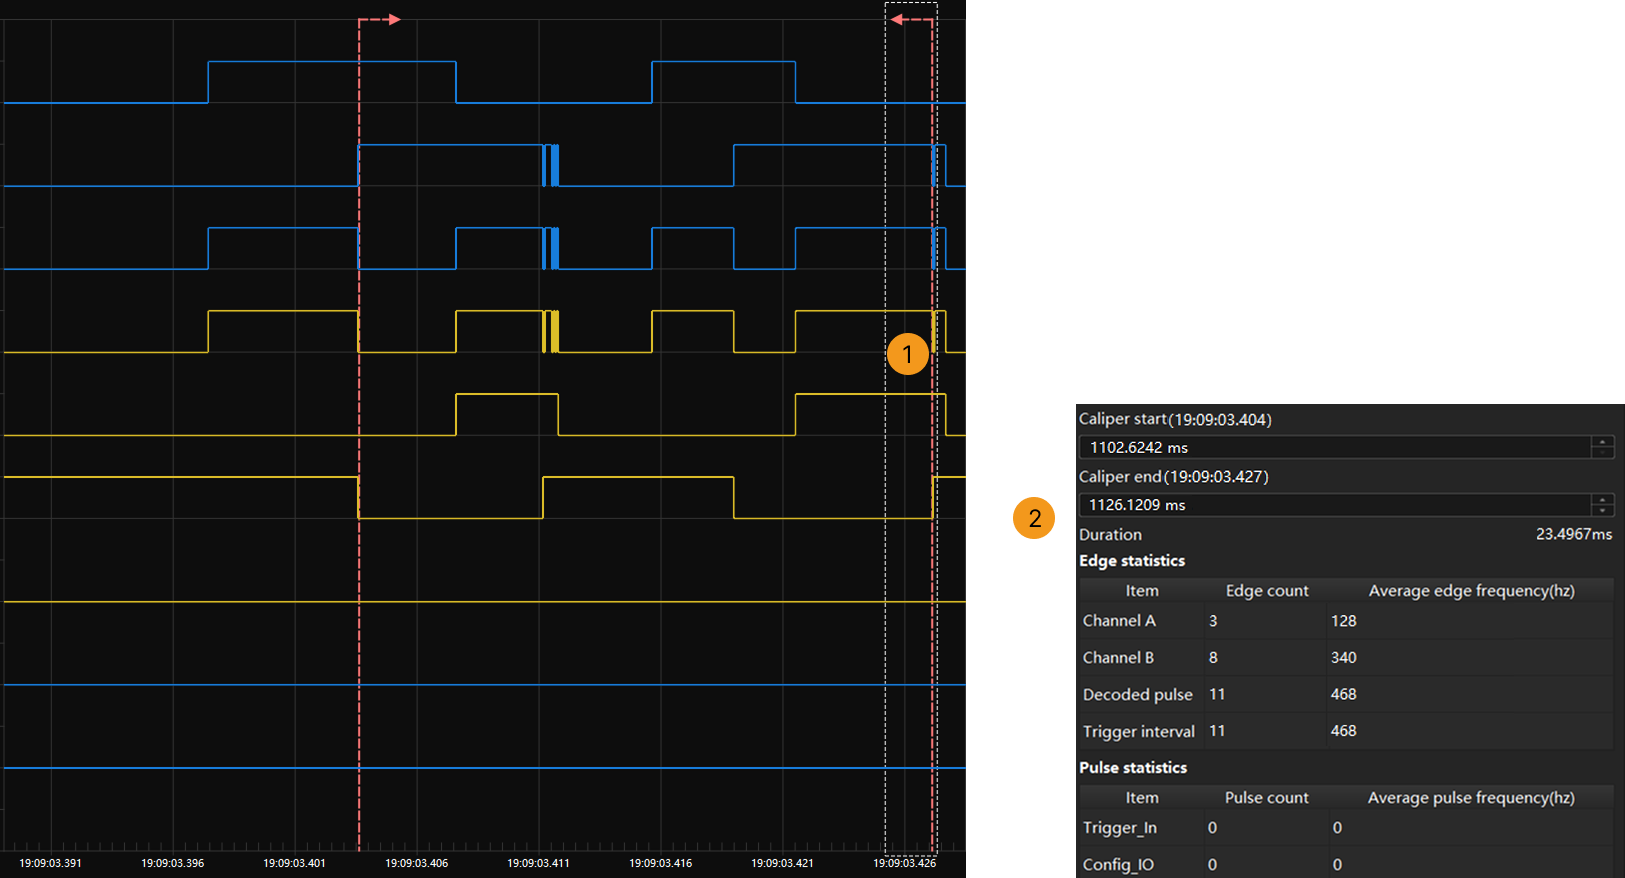
Play back and analyze the encoder and input signals in the waveform area.
Waveforms can be divided into two types:
-
Signal data (blue): Channel A, Channel B, Decoded Pulse, Trigger_In, Config_IO.
-
Analyze data (yellow): Trigger Interval, Overfrequency Range, Abnormal Waveform, Encoder Direction.
Waveforms are defined as follows:
Category Name Description Signal data (blue)
Channel A
Encoder A signal, which is used with channel B to detect the motion position and direction.
Channel B
Encoder B signal, which is used with channel A to detect the motion position and direction.
Decoded Pulse
Pulse signals generated after decoding channel A and channel B signals. These signals represent the motion and position of the encoder.
Trigger_In
External trigger signal for triggering the laser profiler to acquire data.
Config_IO
The I/O signals can be configured as inputs or outputs according to actual needs.
Analyze data (yellow)
Trigger Interval
The interval between two neighboring trigger signals are used to determine whether the trigger is evenly stable.
Overfrequency Range
Calculate the trigger rate based on the interval between two neighboring trigger edges (the trigger rate is the inverse of the interval). Display HIGH when the trigger rate exceeds the set threshold, or else display LOW for quick recognition of trigger rate exceeding the set threshold.
Abnormal Waveforms
Mark encoder waveforms that do not conform to the orthogonal coding rules. Normally, channel A and channel B signals should maintain a fixed phase relationship and change according to the orthogonal coding rule. Waveforms that do not meet this rule will be marked as abnormal, which facilitates the localization of encoder signal issues.
Encoder Direction
It indicates the motion direction of the encoder, which is used to check if the motion direction is correct.
-
-
To analyze the signal statistics further, open the Caliper tool, drag the left and right calipers to select the time period to be analyzed, and view the statistics:
-
If you want to save the analysis results, click Export to save the current data.
|
LNX-7500/LNX-8000 Series
This section applies to LNX-7500/LNX-8000 series (split laser profiler).
The signals that can be viewed correspond to the encoder signal terminals (No. 37 to 54) and input signal terminals (No. 1 to 6 and No. 9 to 11) on the controller.
|
Follow the steps below to view the signals input from the encoder and other external devices:
-
Ensure that the signal cables of the device(s) to be viewed are properly connected to the signal terminals of the controller.
-
To connect an encoder with the controller, refer to Signal Circuit Diagrams and Encoder Signal Terminals.
-
To connect other devices with the controller, refer to Control Data Acquisition with External Device.
-
-
Set Signal collection period (ranging from 10 to 60 s) in the right panel, and click Start collection. The tool will display signals collected during this period.
To stop collecting signals during the period, click Stop collection. -
View the collected signals in the left panel. The horizontal axis, representing time, helps determine the input timing of signals and the duration of logic signals.
-
If the tool fails to display the signals sent by external device(s), check the connection between the external device(s) and the controller.
-
You can scroll the mouse wheel to zoom the time axis.
Signals are divided into three categories:
-
Single-ended encoder: Displays signals from the single-ended encoder.
-
Differential encoder: Displays signals from the differential encoder.
-
Input signals: Displays signals from other external devices, such as PLC and photoelectric sensors.
Displayed name Terminal No. LEVELCONTROL_ENABLE
9
MEASURE_START
10
MEASURE_STOP
11
IN1
1
IN2
2
IN3
3
IN4
4
IN5
5
IN6
6
-