Adjust Parameters
This topic introduces how to adjust parameters when calibrating a single or multiple laser profilers. You should adjust the parameters in the profile mode and scan mode in sequence. Since the intensity image, depth map, and point cloud reflects the overall status of the profiles, some issues in these data might need to be addressed in the profile mode.
|
Please adjust the parameters for each laser profiler according to the instructions in the following sections.
Adjust Parameters in Profile Mode
Please follow the procedure below to adjust the parameters in the profile mode.
-
Create a new parameter group based on the template Multiple laser profiler calibration. Ensure that:
-
The toggle switches Enable Tilt Correction and Enable Height Correction in the Correction category are turned off.
-
The parameters in the table below are set to their default values:
Category Parameter Default value Brightness Settings
Analog Gain
1×
Digital Gain
0
Profile Processing
Filtering
None
Gap filling
0
Gap Filling Edge Preservation
3
Resampling
Nearest
Resampling Edge Preservation
3
-
-
Click Profile Mode, and turn on the display of Intensity and sharpness curves in the raw image display area.
-
Click the button
 in the data acquisition area to trigger one round of data acquisition.
 -
Check the data quality.
-
If the acquired data meets the following requirements, parameter adjustment for the profile mode is complete. Please proceed to the next section.
-
The profiles are free of noise or outliers.
-
The profiles of the frustum’s lateral surfaces are continuous without missing spots.
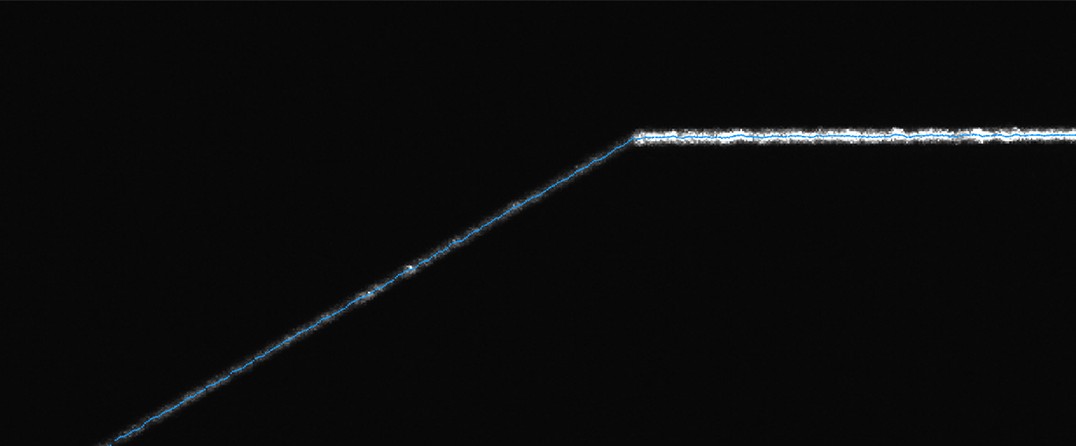
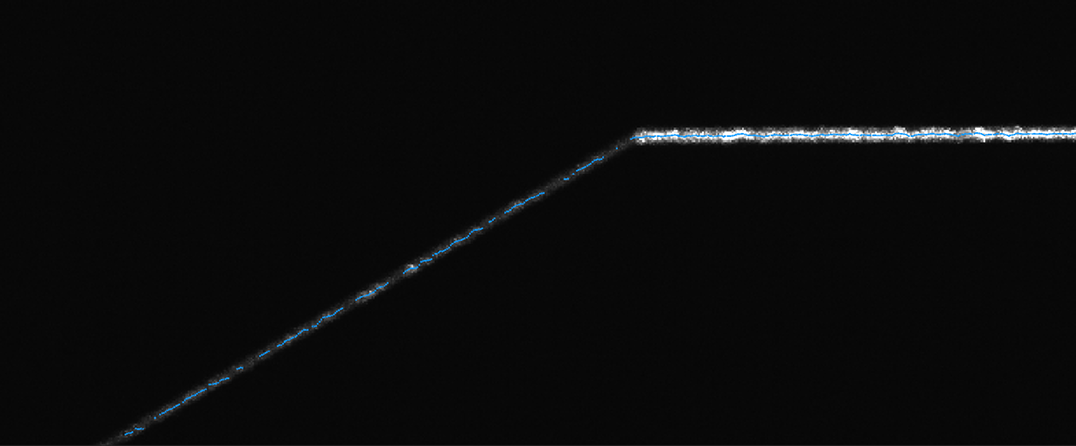
 Continuous profile of the lateral surface
 Discontinuous profile of the lateral surface
 -
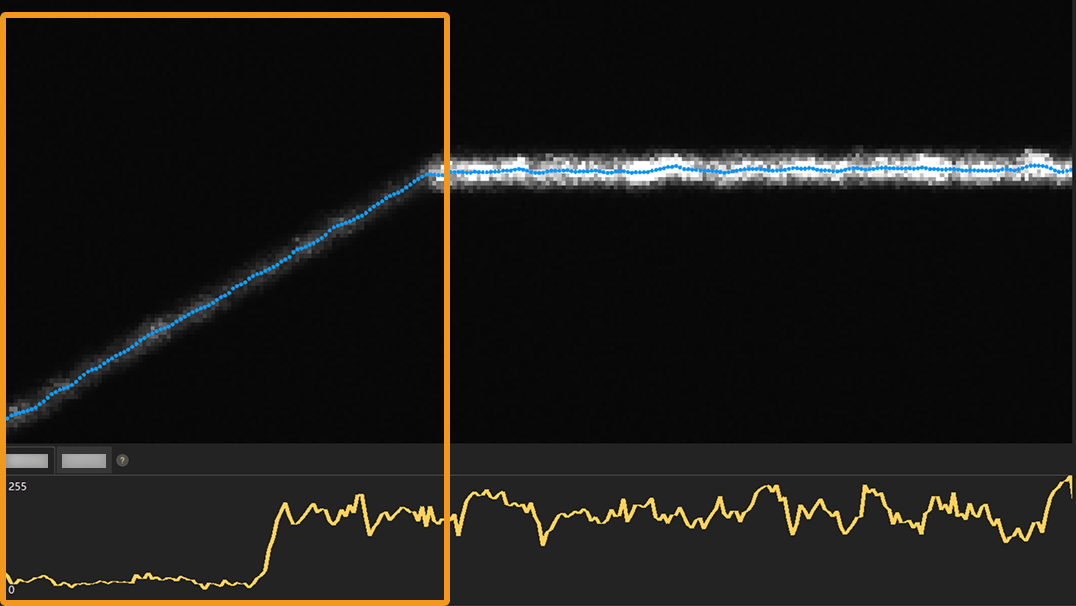
The spot intensity values in the profiles of the lateral surfaces should be above 20. Hover the mouse cursor over the intensity curve to view the spot intensity value.
-
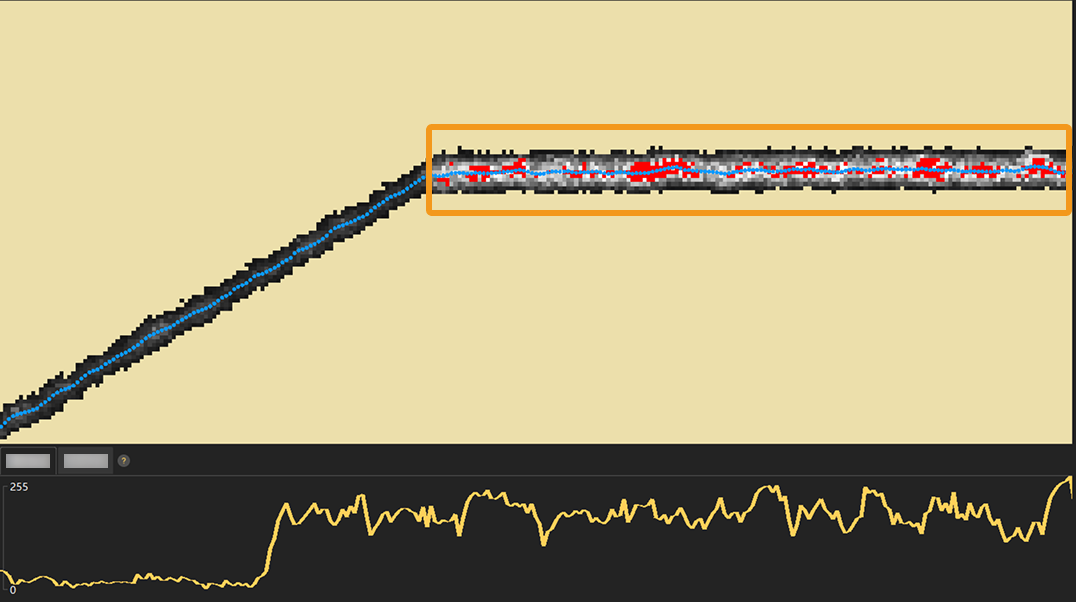
After Exposure information is switched on, each pixel column of the profiles of the frustum’s upper base and foundation surface should contain one to three spots with a grayscale value of 255 (displayed in red).
-
-
If the acquired data has the issues listed in the table below, adjust parameters according to the corresponding solutions, and then go to step 3.
Symptom Solutions Profile brightness too low:
-
The profiles of the frustum’s lateral surfaces are discontinuous.
-
The spot intensity values in the profiles of the frustum’s lateral surfaces are below 20.
-
Each pixel column of the profiles of the frustum’s upper base and foundation surface contains less than one to three overexposed spots in average.
-
Increase the Exposure Time parameter in the Brightness Settings category.
Do not set the Exposure Mode parameter to HDR.
-
If the requirements cannot be met by adjusting the Exposure Time parameter alone, increase the Laser Power parameter value in the Brightness Settings category.
Profile brightness too high:
-
Each pixel column of the profiles of the frustum’s upper base and foundation surface contains above three overexposed spots in average.
-
Decrease the Exposure Time parameter in the Brightness Settings category.
Do not set the Exposure Mode parameter to HDR.
-
Decrease the Laser Power parameter in the Brightness Settings category.
Overexposed and underexposed areas coexist in the profiles:
-
The profiles of the frustum’s lateral surfaces are discontinuous.
-
The spot intensity values in the profiles of the frustum’s lateral surfaces are below 20.
-
Each pixel column of the profiles of the frustum’s upper base and foundation surface contains above three overexposed spots in average.
-
Increase the Exposure Time parameter in the Brightness Settings category to an appropriate value to ensure that the profile brightness of the frustum’s lateral surfaces meets the requirements while the profiles of the frustum’s upper base and foundation surface are overexposed to a reasonable degree.
Do not set the Exposure Mode parameter to HDR.
Outliers appear near the profiles.
-
Clean the surfaces of the calibration target and the windows of the laser profiler to prevent dust and stains from affecting data quality.
-
Adjust the Outlier Removal parameter in the Profile Processing category.
Reflection causes noise near the profiles.
-
-
Adjust Parameters in Scan Mode
Please follow the procedure below to adjust the parameters in the scan mode.
-
Set parameters in the Trigger Settings category according to the table below:
Parameter Parameter value Frame-Based
External or Software
Encoder
-
During calibration, refer to Workflow of Triggering Data Acquisition to acquire data. If Data Acquisition Trigger Source is set to Software, wait for one to two seconds after all laser profilers enter acquisition ready status, and then proceed to the following steps.
-
To ensure high calibration accuracy, do not set the Line Scan Trigger Source parameter to Fixed rate.
-
Ensure that the above parameters are set to the same value for all laser profilers.
-
-
Calculate and adjust the parameters in the Encoder Settings category based on the Y-axis resolution of scan data.
Ensure that the Y-Axis Resolution parameters of all laser profilers are set to the same value, and the Y-axis resolutions of scan data of all laser profilers are the same. -
Calculate and set the Scan Line Count parameter in the Scan Settings category:
-
Measure the distance between the scan start and end positions, namely the scan range.
-
Calculate the number of lines required to fully scan the calibration target: Line count = Scan range ÷ Y-axis resolution of the scan data
-
Round the result down to the nearest whole number. You can also omit a small number of lines as appropriate, and set the resulting value as the Scan Line Count parameter.
For example, when the scan range is 400 mm and the Y-axis resolution of the scan data is 0.105 mm: Line Count = 400 ÷ 0.105 = 3809.5238. After rounding down, set the Scan Line Count parameter to 3809. Alternatively, you can omit a few lines and set it to 3800.
-
-
Confirm that the toggle switches of the parameters in the following categories are turned off: Profile Alignment, Correction, and Filtering.
-
Click the button
in the data acquisition area to trigger one round of data acquisition. -
Check data quality.
-
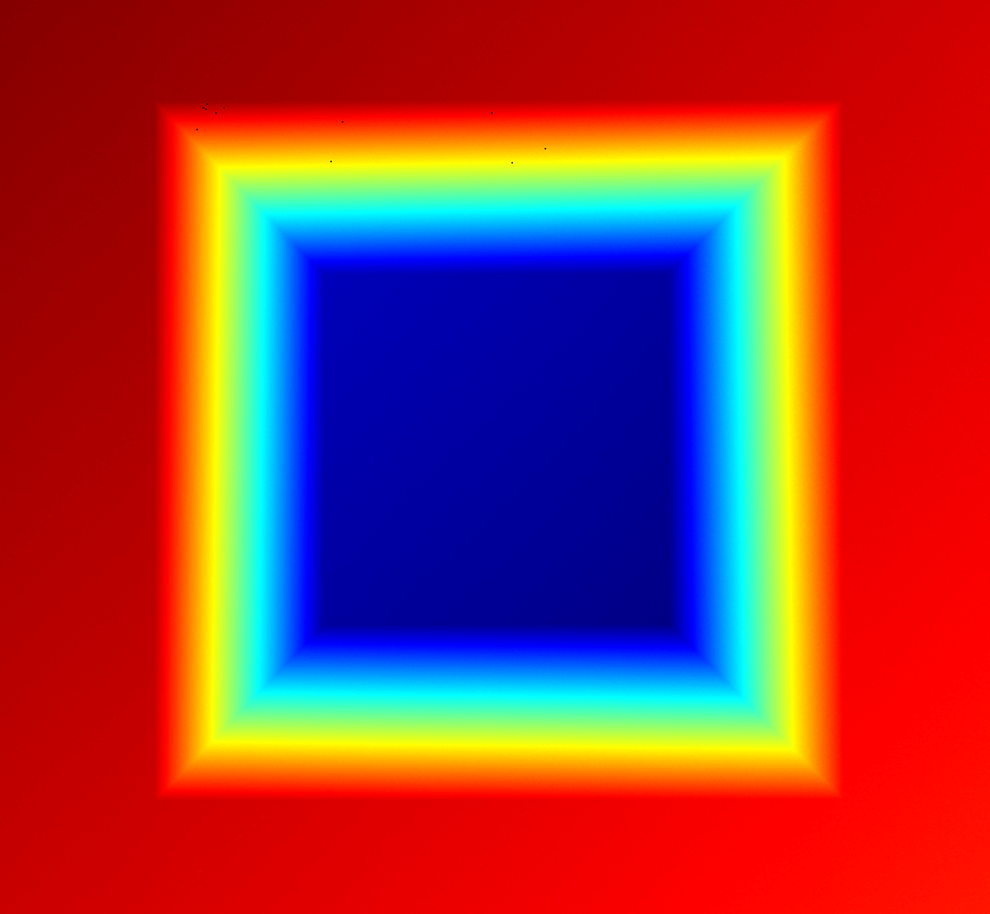
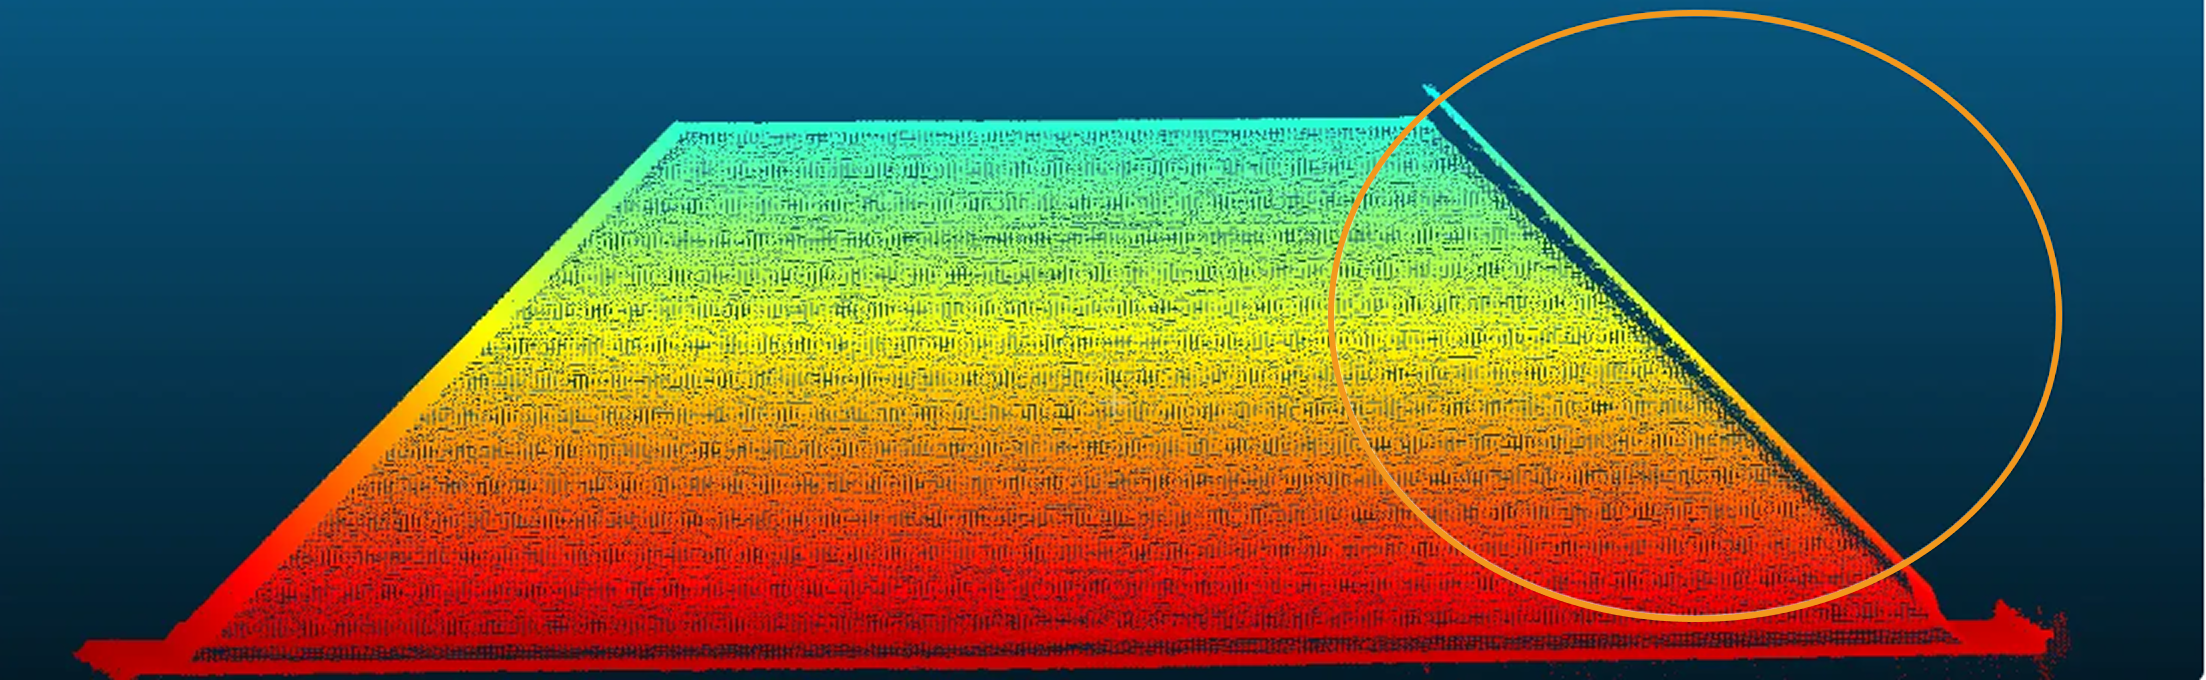
If the depth map and point cloud are complete, include all six feature surfaces of the calibration target (numbered 1 to 6 in the figure below), and contain no other surfaces, parameter adjustment for the scan mode is complete.
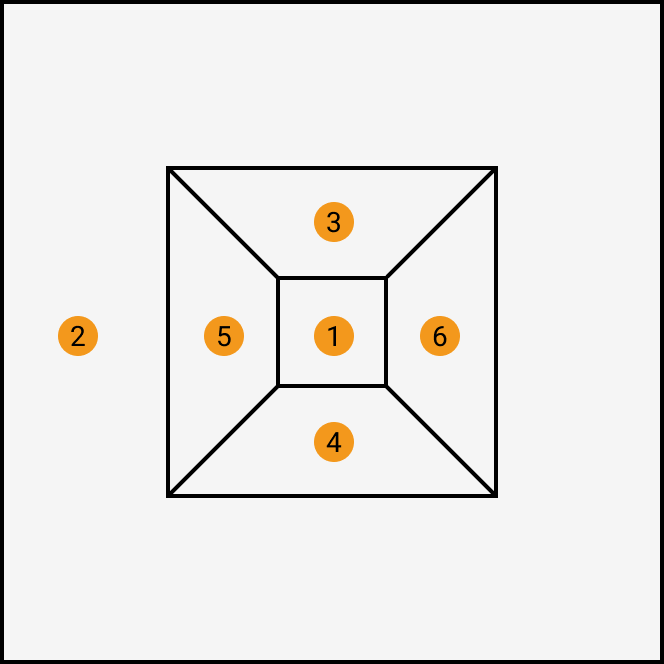
Six feature surfaces of the calibration target
Complete point cloud including only six feature surfaces -
If the acquired data has the issues in the table below, adjust parameters according to the corresponding solutions, and then go to step 5.
Symptom Solutions 
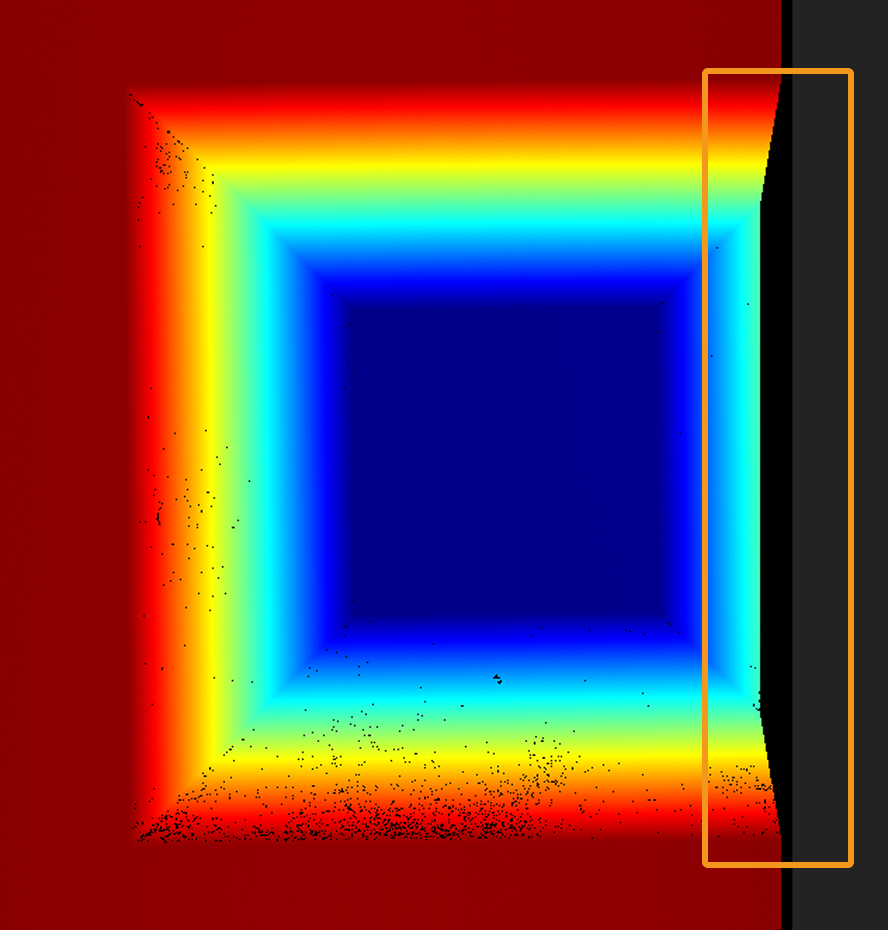
Extra surface exists in the point cloud.
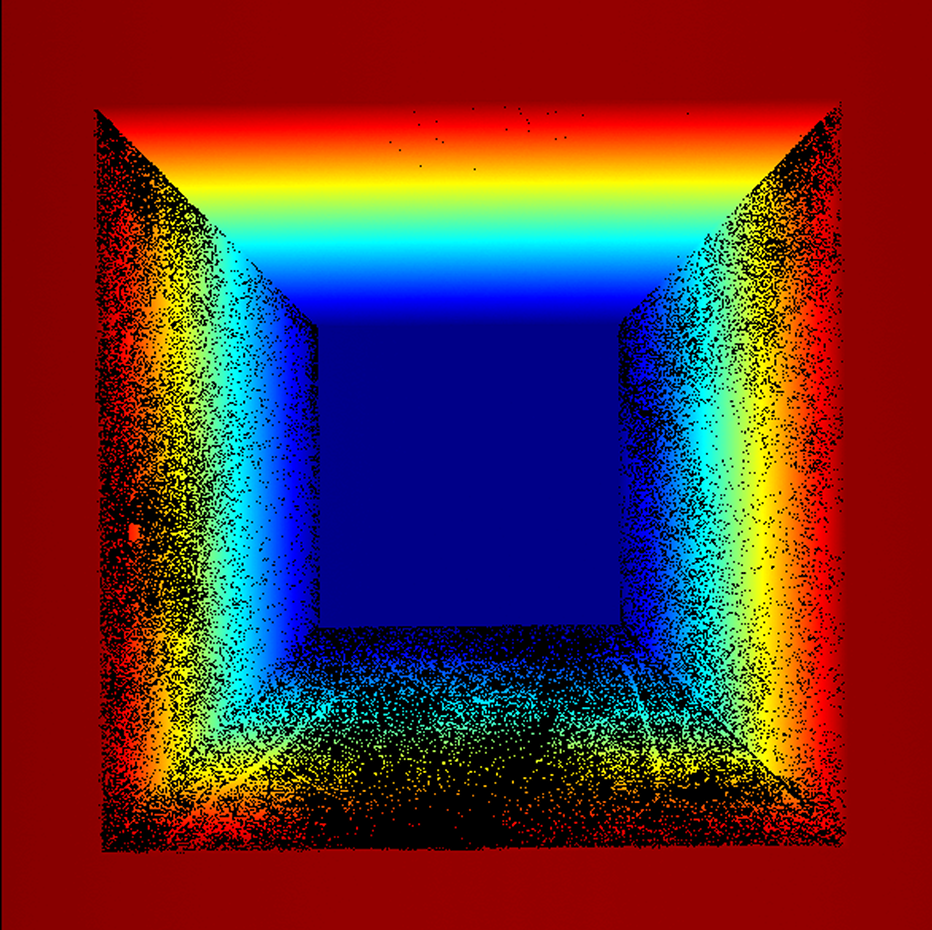
Too many points are missing in the point cloud.
Click Profile Mode, and then:
-
Increase the Exposure Time parameter in the Brightness Settings category.
-
Decrease the Outlier Removal parameter in the Profile Processing category.
Feature surface data is missing the point cloud.
Adjust the position of the calibration target to ensure all six feature surfaces are within the FOV of the laser profiler.
A duplicate layer appears in the point cloud due to laser light interference caused by overlapping FOVs.
Set the Trigger Delay parameter.
-
This parameter is visible in the Guru level.
-
It is recommended to set the value to 1.5 times the Exposure Time parameter of the laser profiler that emits laser light first, and then fine-tune the value based on the result.
Outliers appear near the point cloud.
-
Clean the surfaces of the calibration target and the windows of the laser profiler to prevent dust and stains from affecting data quality.
-
Click Profile Mode, and increase the Outlier Removal parameter in the Profile Processing category.
Noise appears near the point cloud due to reflection.
-
Remove or cover reflective objects.
-
If reflective objects cannot be removed or covered, use a mask to exclude interference.
-
-
-
Save the changes made to the parameter group.