View Visualized Data in Mech-MSR
In the Mech-MSR, you can view the input and output of Steps in Data Viewer, draw and adjust ROIs in 2D Data Viewer, and adjust the position and size of feature regions in 3D Data Viewer.
| You can use data viewer only after Debug Output is enabled in the graphical programming workspace. |
Switch Data View
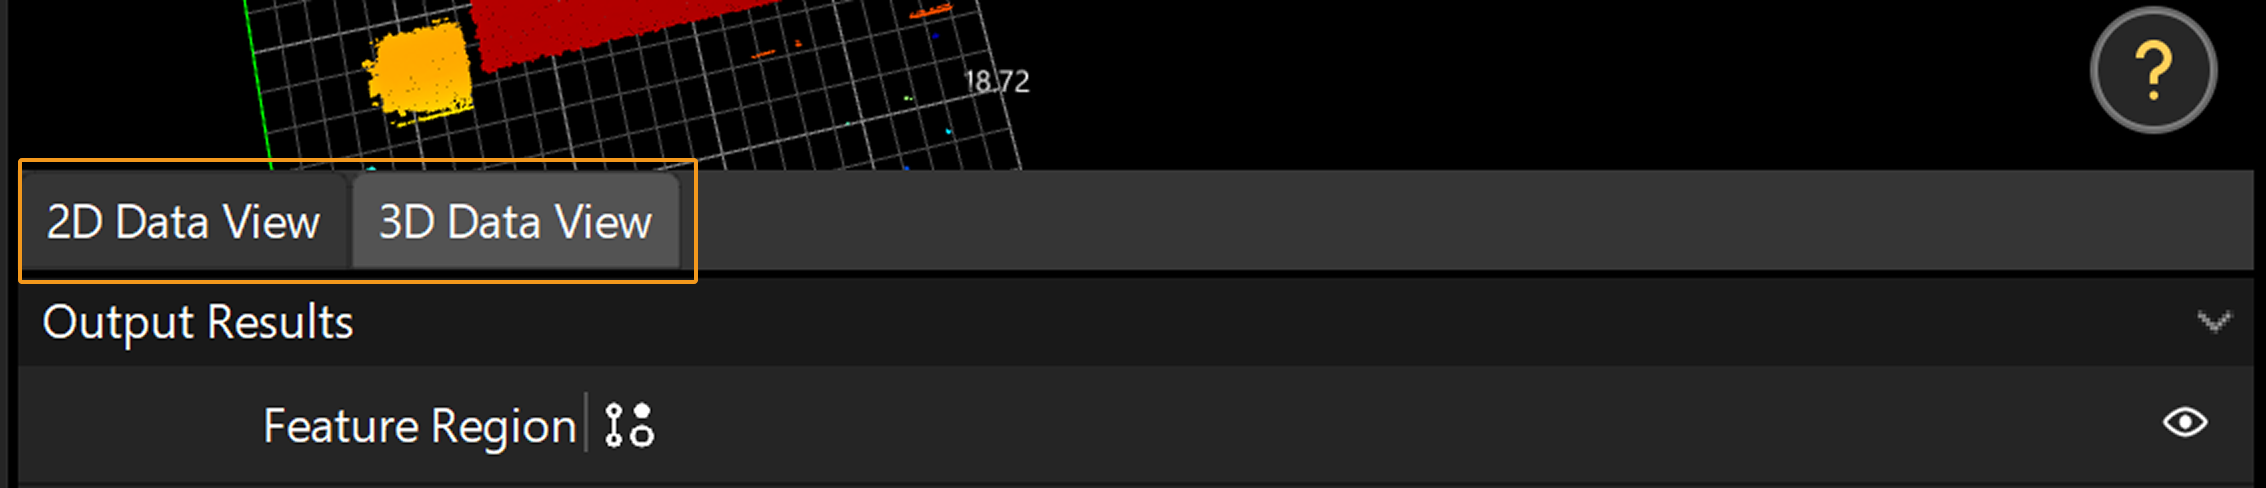
In the lower-left corner of the data visualization window, you can click to switch between 2D Data View and 3D Data View.
| Switch to 2D Data View when debugging 2D Steps. Switch to 3D Data View when debugging 3D Steps. |
2D Data View
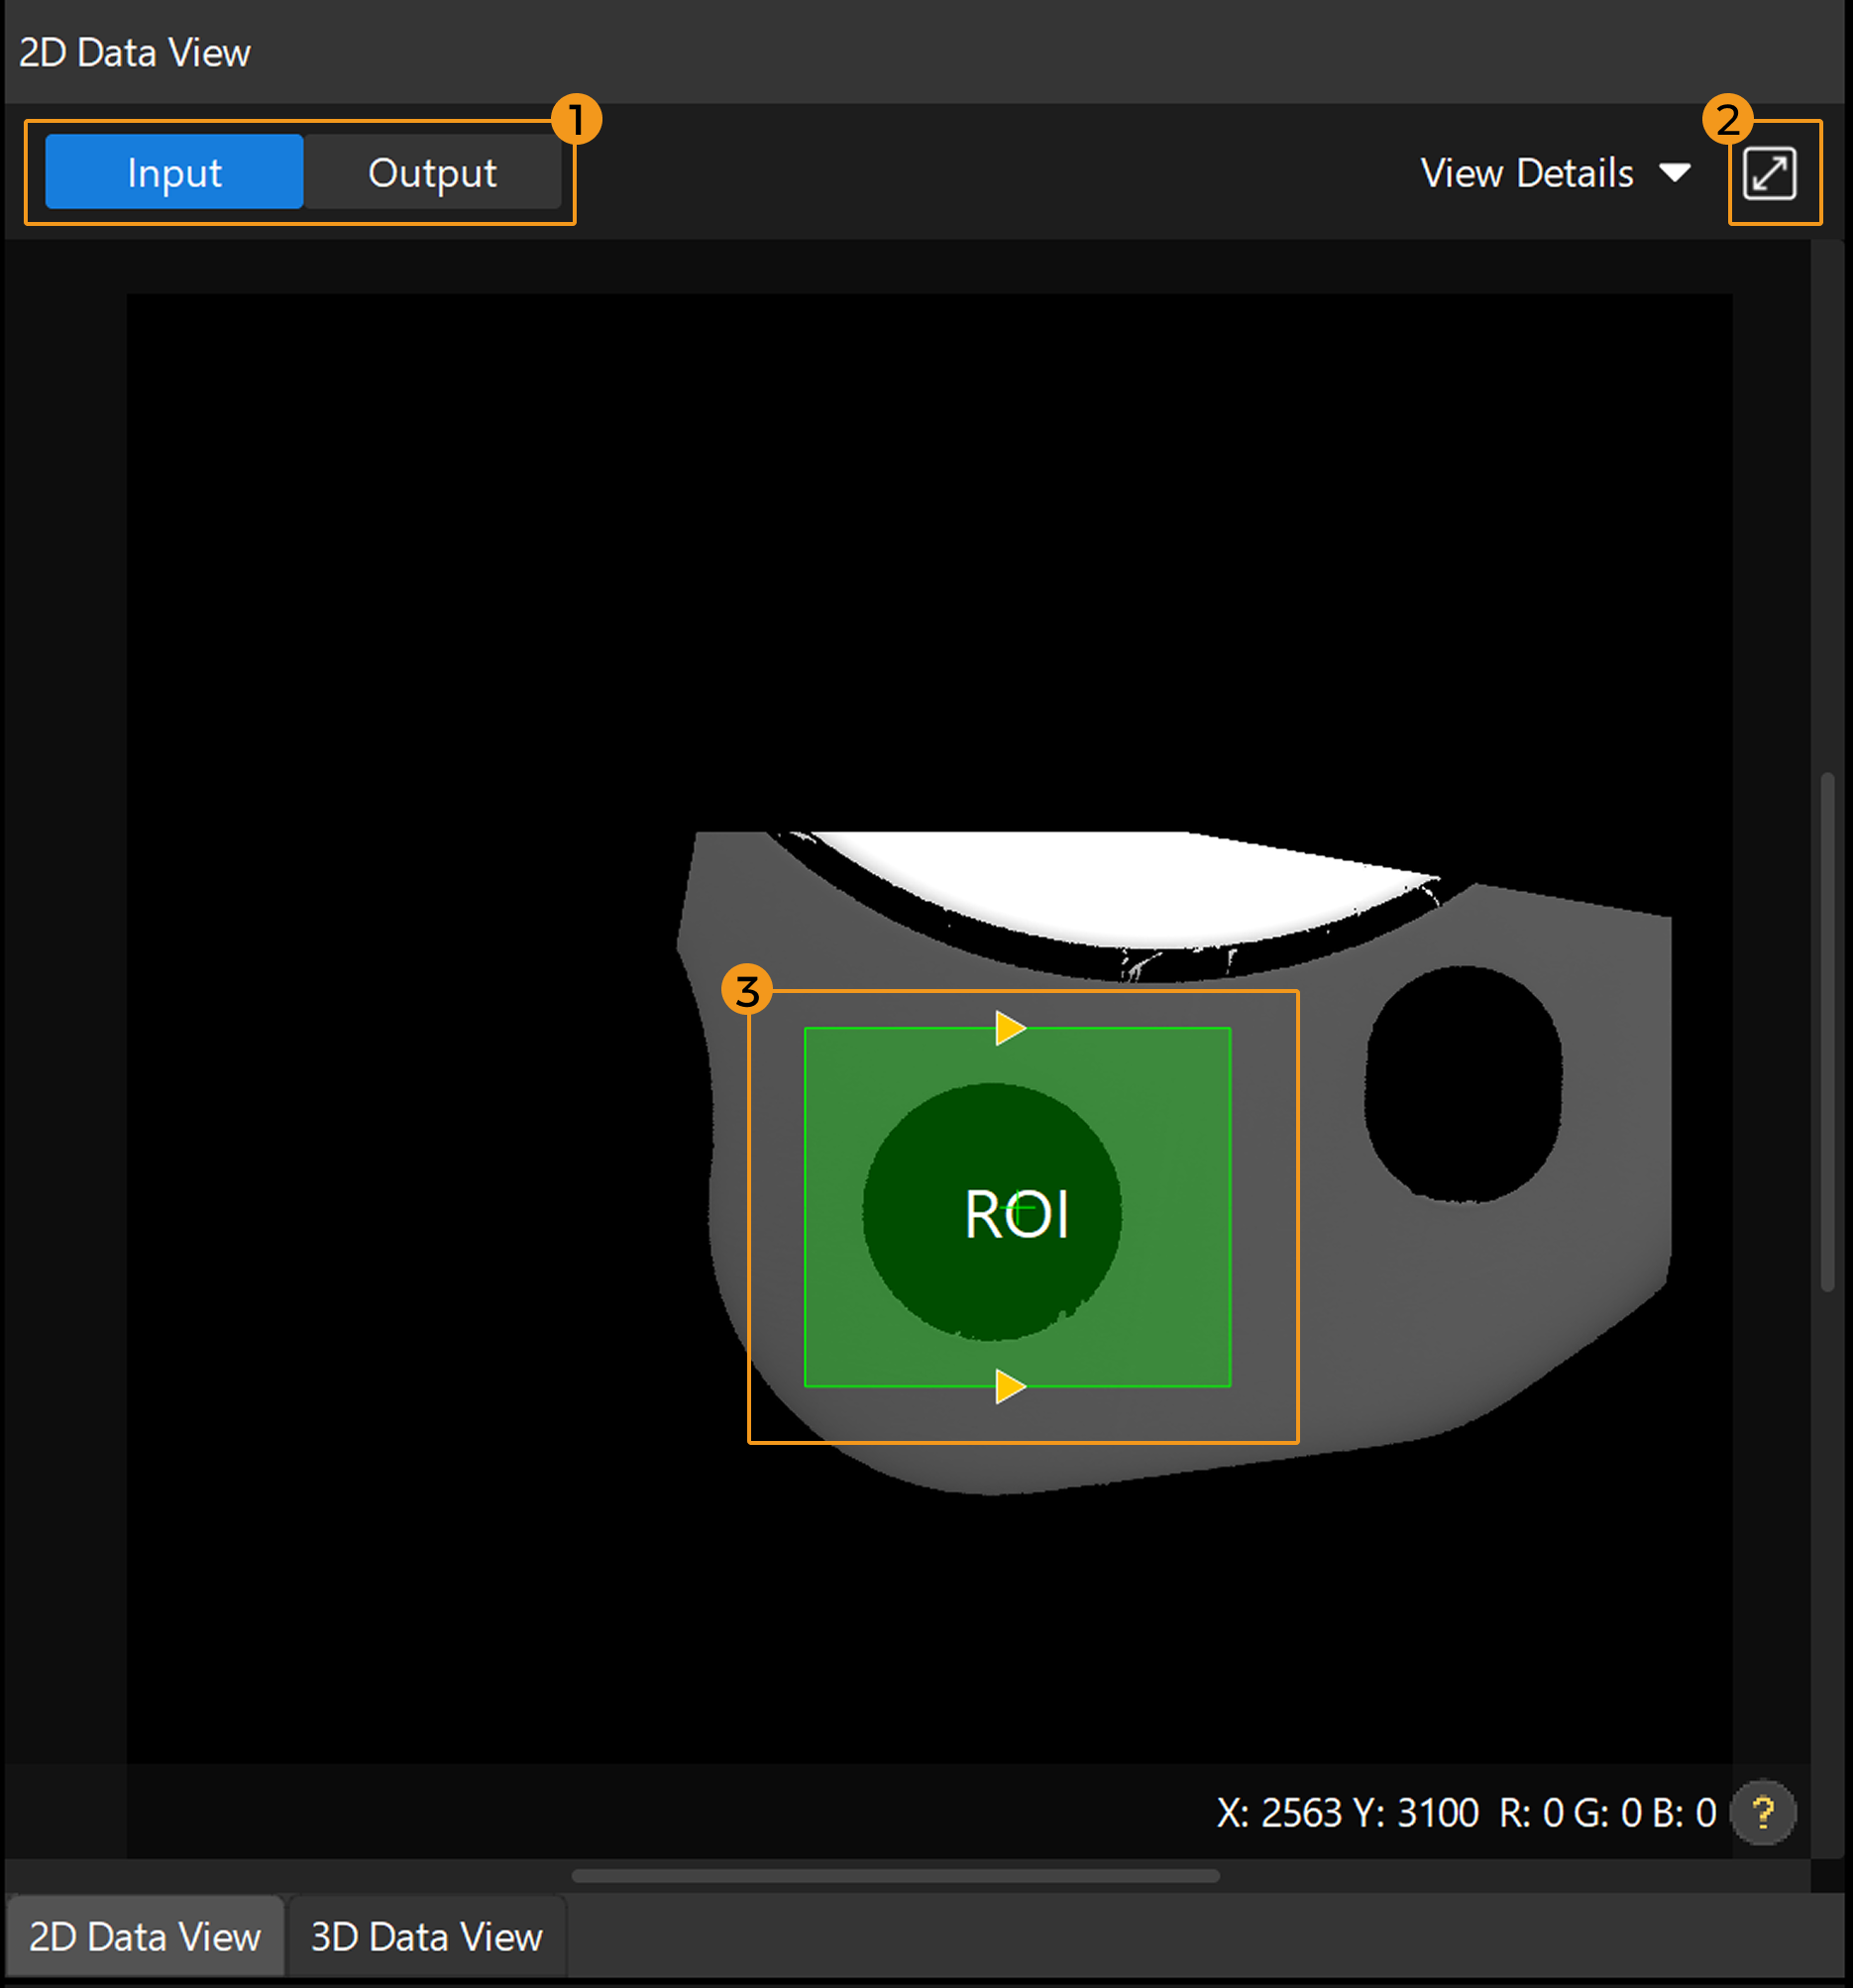
In 2D Data viewer, you can view the input or output image of a Step and draw or adjust an ROI directly on the image.
 |
|---|
①- Switch Input and Output; ②- Adjust View; ③- Set ROI |
Switch Input and Output(①)
You can switch between viewing the Input and Output of the current Step in the upper left corner of the 2D data viewer.
Adjust the View (②)
In 2D Data View, you can adjust the view in the following ways:
| Action | Instructions |
|---|---|
Zoom in/out |
Scroll the mouse. |
Pan the view |
Press and hold the left mouse button and drag. |
Move or Adjust ROI |
Press and hold the left mouse button and drag. |
Fit the view |
Click the adaptive icon |
Set ROI(③)
In the 2D data viewer, you can directly draw and adjust the ROI to quickly set the position, size, and shape of the region to be processed.
For detailed instructions, refer to Draw and Adjust ROI in 2D Data View.
3D Data View
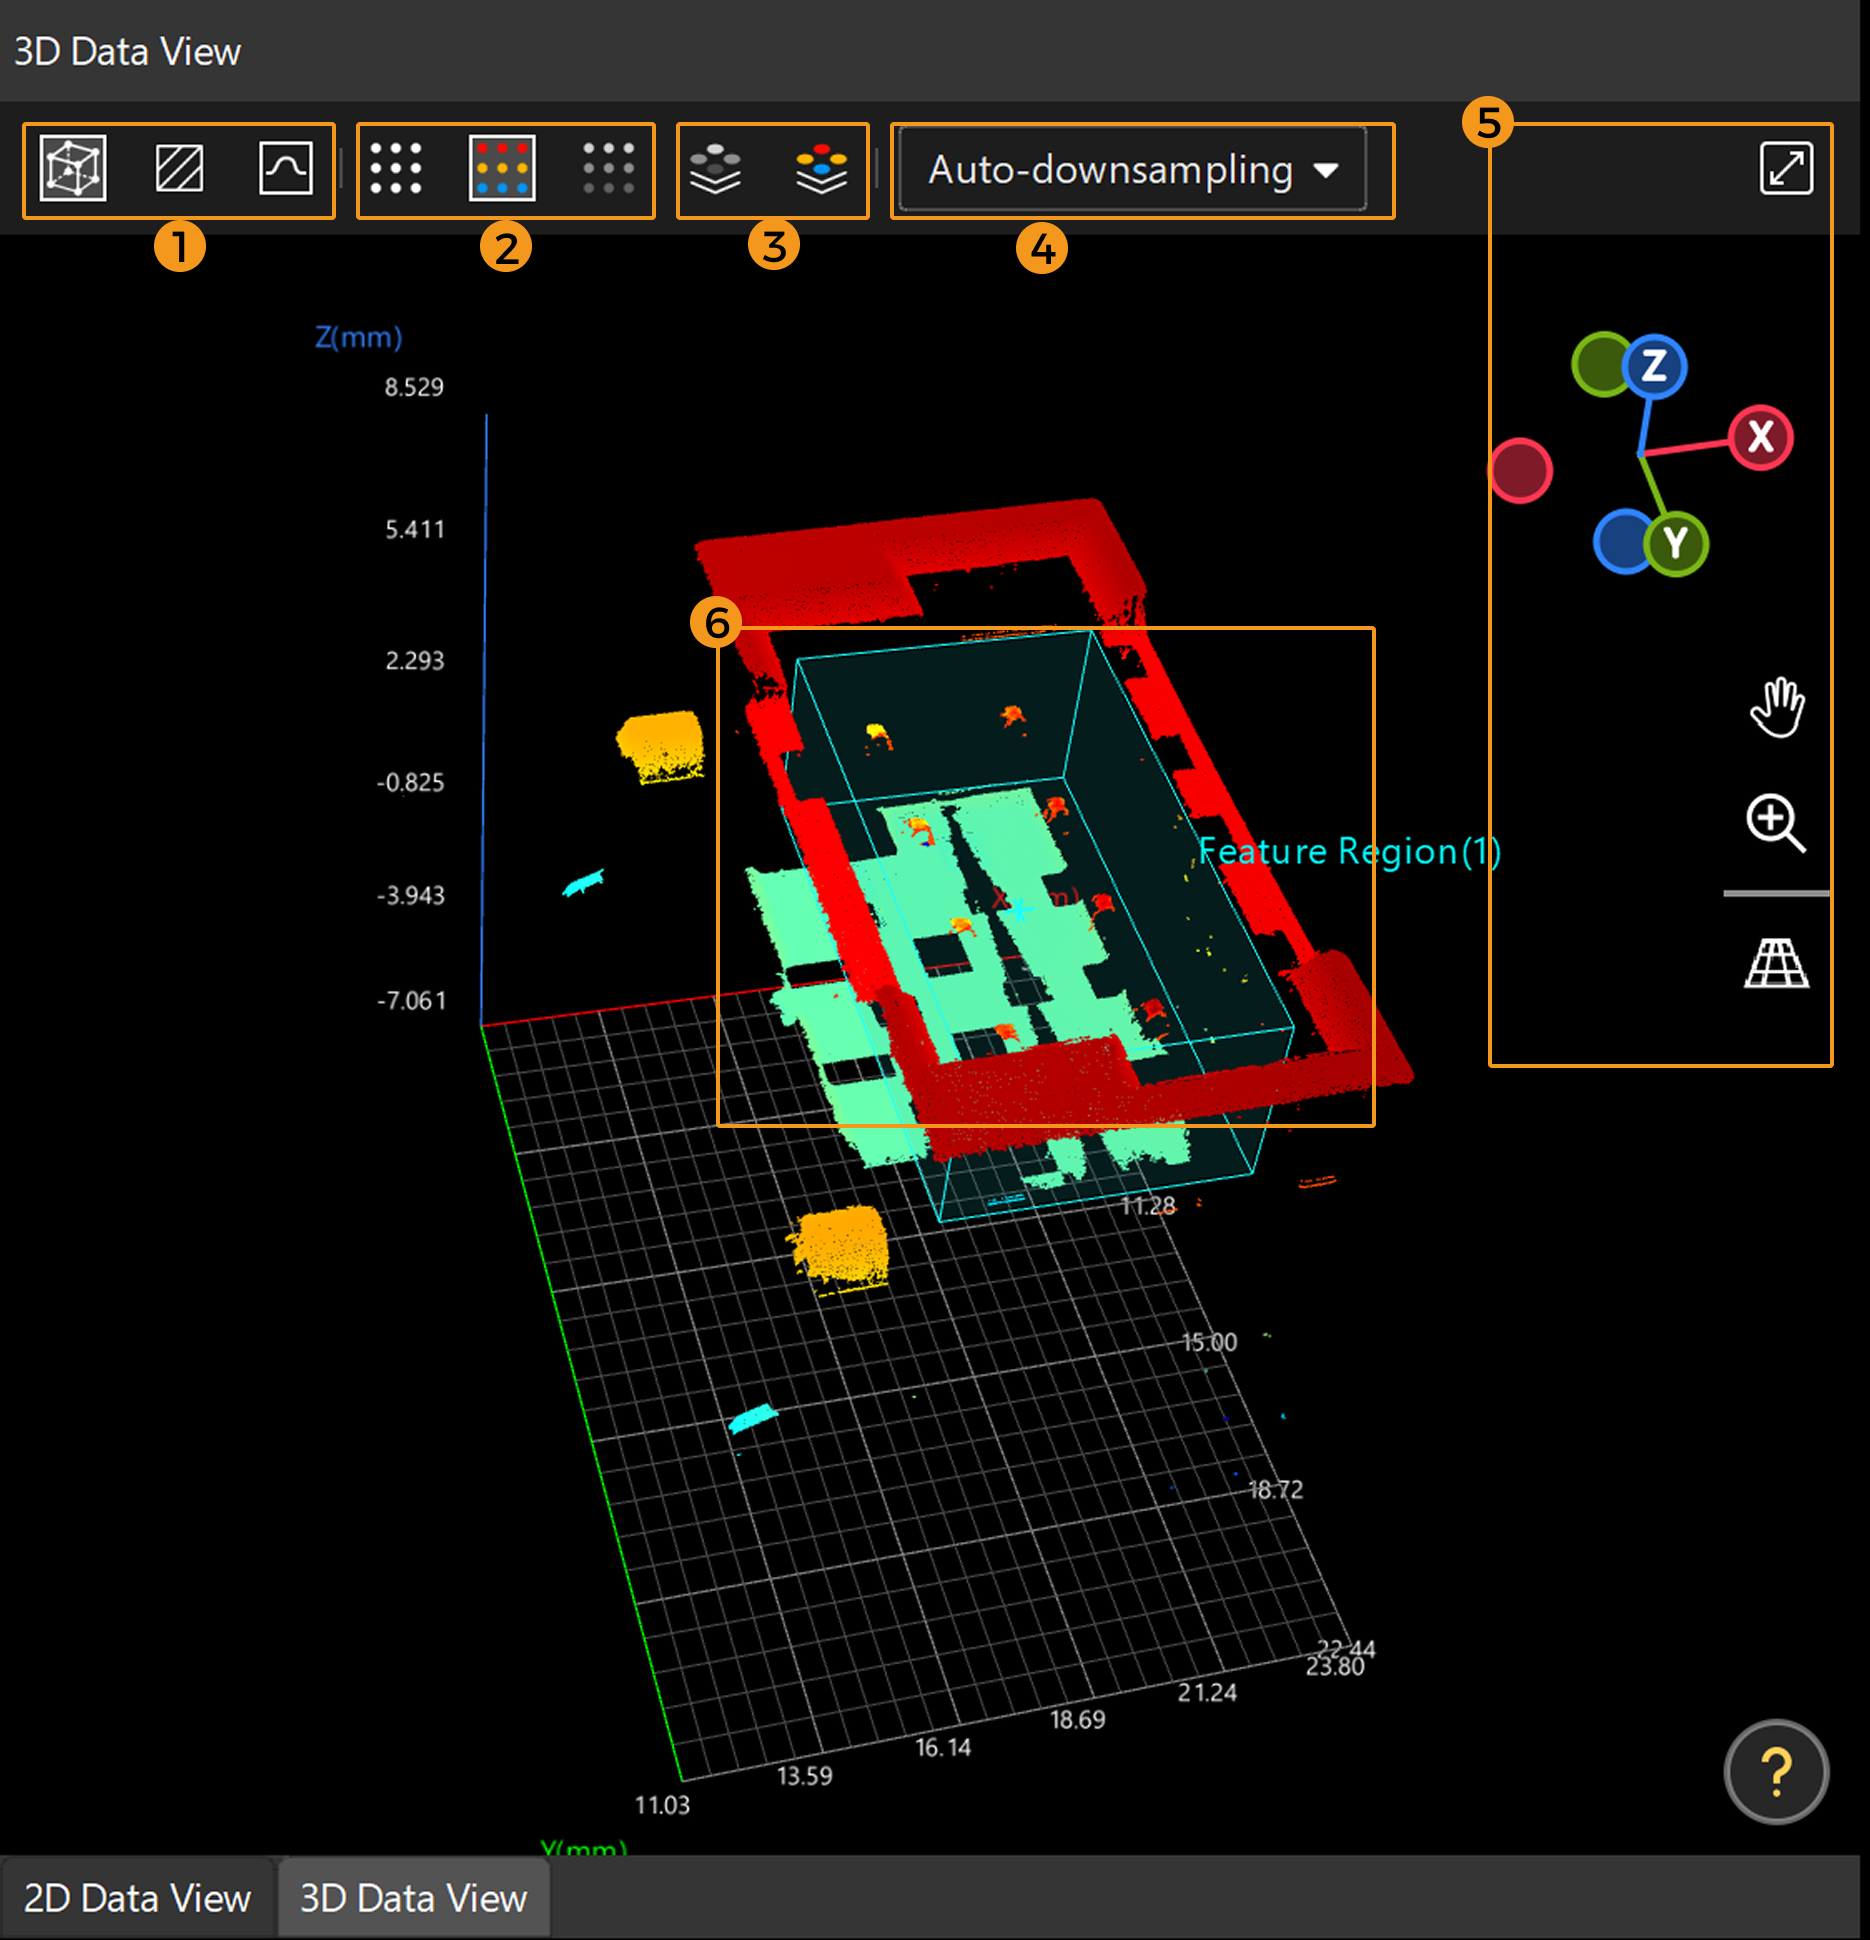
In 3D Data viewer, you can view 3D relevant data such as point clouds, intensity images, and profiles, and adjust feature regions.
 |
|---|
①-Switch the display mode; ②-Switch the point cloud mode; ③-Switch the intensity image mode; ④-Downsample setting; ⑤-Adjust the view; ⑥-Set the feature region |
Switch the Display Mode (①)
In 3D Data viewer, you can use the following icons to switch the display mode:
-
Click the Perspective Mode icon
 to switch to the Perspective Mode and view the data in a 3D perspective.
 -
Click the Surface Mode icon
 to switch to the Surface Mode and view the data on the XOY plane.
 -
Click the Profile Mode icon
 to switch to the Profile Mode and view the data on the XOZ plane. Profiles are usually processed in this view.
Switch the Point Cloud Mode (②)
Use the following icons to switch the point cloud mode:
-
Click the Monochrome Point Cloud
 icon to switch to Monochrome Point Cloud.
 -
Click the Color Point Cloud icon
 to switch to a Color Point Cloud.
 -
Click the Grayscale Point Cloud icon
 to switch to the Grayscale Point Cloud.
Switch the Intensity Image Mode (③)
Use the following icons to switch the intensity image mode:
-
Click the Intensity Image icon
 to switch to the Intensity Image.
 -
Click the Color Intensity Image
 icon to switch to the Color Intensity Image.
Downsampling Settings (④)
When the image size is large, the software may take longer to process the data for visualization. Enabling Debug Output could result in performance lag. You can reduce the image resolution by downsampling to lower the data volume and speed up visualization.
-
Auto-downsampling: Automatically selects the optimal downsampling ratio according to the image size to balance the visualization speed and image details.
-
No downsampling: Maintains the original image resolution without applying downsampling.
-
Fixed ratio: Scales the image down to 1/2, 1/4, 1/6, 1/8, 1/10, 1/12, 1/14, or 1/16 of its original width and height. A smaller ratio (e.g., 1/16) means faster visualization but a greater loss of image details.
| The downsampling setting only affects the display and does not impact the calculation results of the Steps. |
|
Mech-Mind IPC provides the standard operation environment for Mech-Mind’s software products and therefore can maximize the function and performance of the software. For better user experience, please select an appropriate IPC according to the data volume of images or point clouds in the actual project:
Note that even if the number of points in the image or point cloud is within the processing capacity of the selected IPC, enabling Debug Output may still cause lag when using the software due to high system resource usage. If a severe lag occurs, it is recommended to increase the degree of downsampling. |
Adjust the View (⑤)
Use the following buttons or shortcuts to adjust the view:
| Action | Instructions |
|---|---|
Rotate the view |
Press and hold the left mouse button and drag in any direction. |
Pan the view |
Press and hold the open-hand icon |
Zoom in/out |
Press and hold the zoom out icon |
Fit the view |
Click the adaptive icon |
The navigation gizmo ![]() shows the orientation of the current view. Click the icon of each axis (X, Y, Z, -X, -Y, -Z) to align the view with the axis.
shows the orientation of the current view. Click the icon of each axis (X, Y, Z, -X, -Y, -Z) to align the view with the axis.
Set the Feature Region(s) (⑥)
Feature regions define the target regions for algorithm processing. You can roughly and intuitively adjust the position and size of the feature region(s) in the data viewer area.
For detailed instructions, see Adjust Feature Region in Data Viewer Area.