User Interface
This section describes the interface layout, functional areas, and settings of the Repair Viewer.
Start Page
After the Repair Viewer starts, the start page is displayed, as shown below.
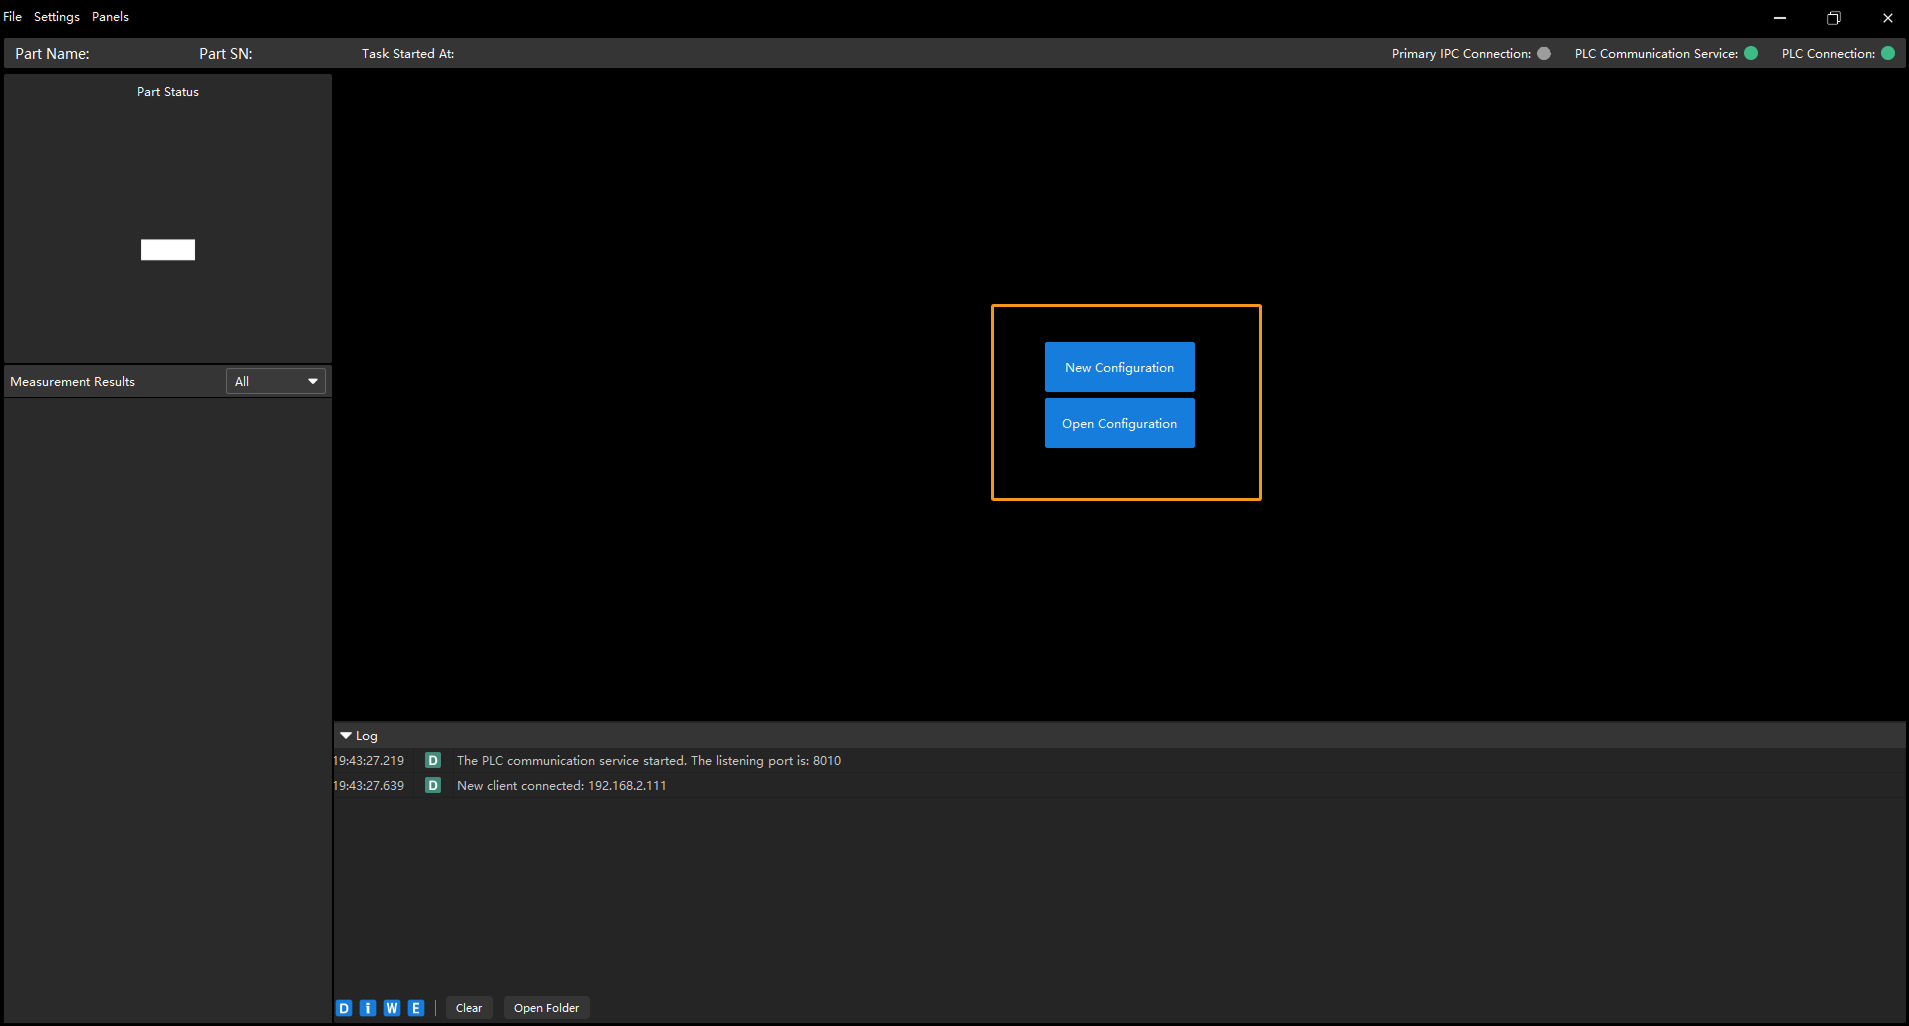
On the start page, you can perform the following operations:
-
Click New Configuration to create a configuration for the current repair station. For details, see Create a Configuration.
-
Click Open Configuration to open a saved configuration.
Main Interface
After a configuration is created or opened, the main interface is displayed. The main interface consists of the following areas.
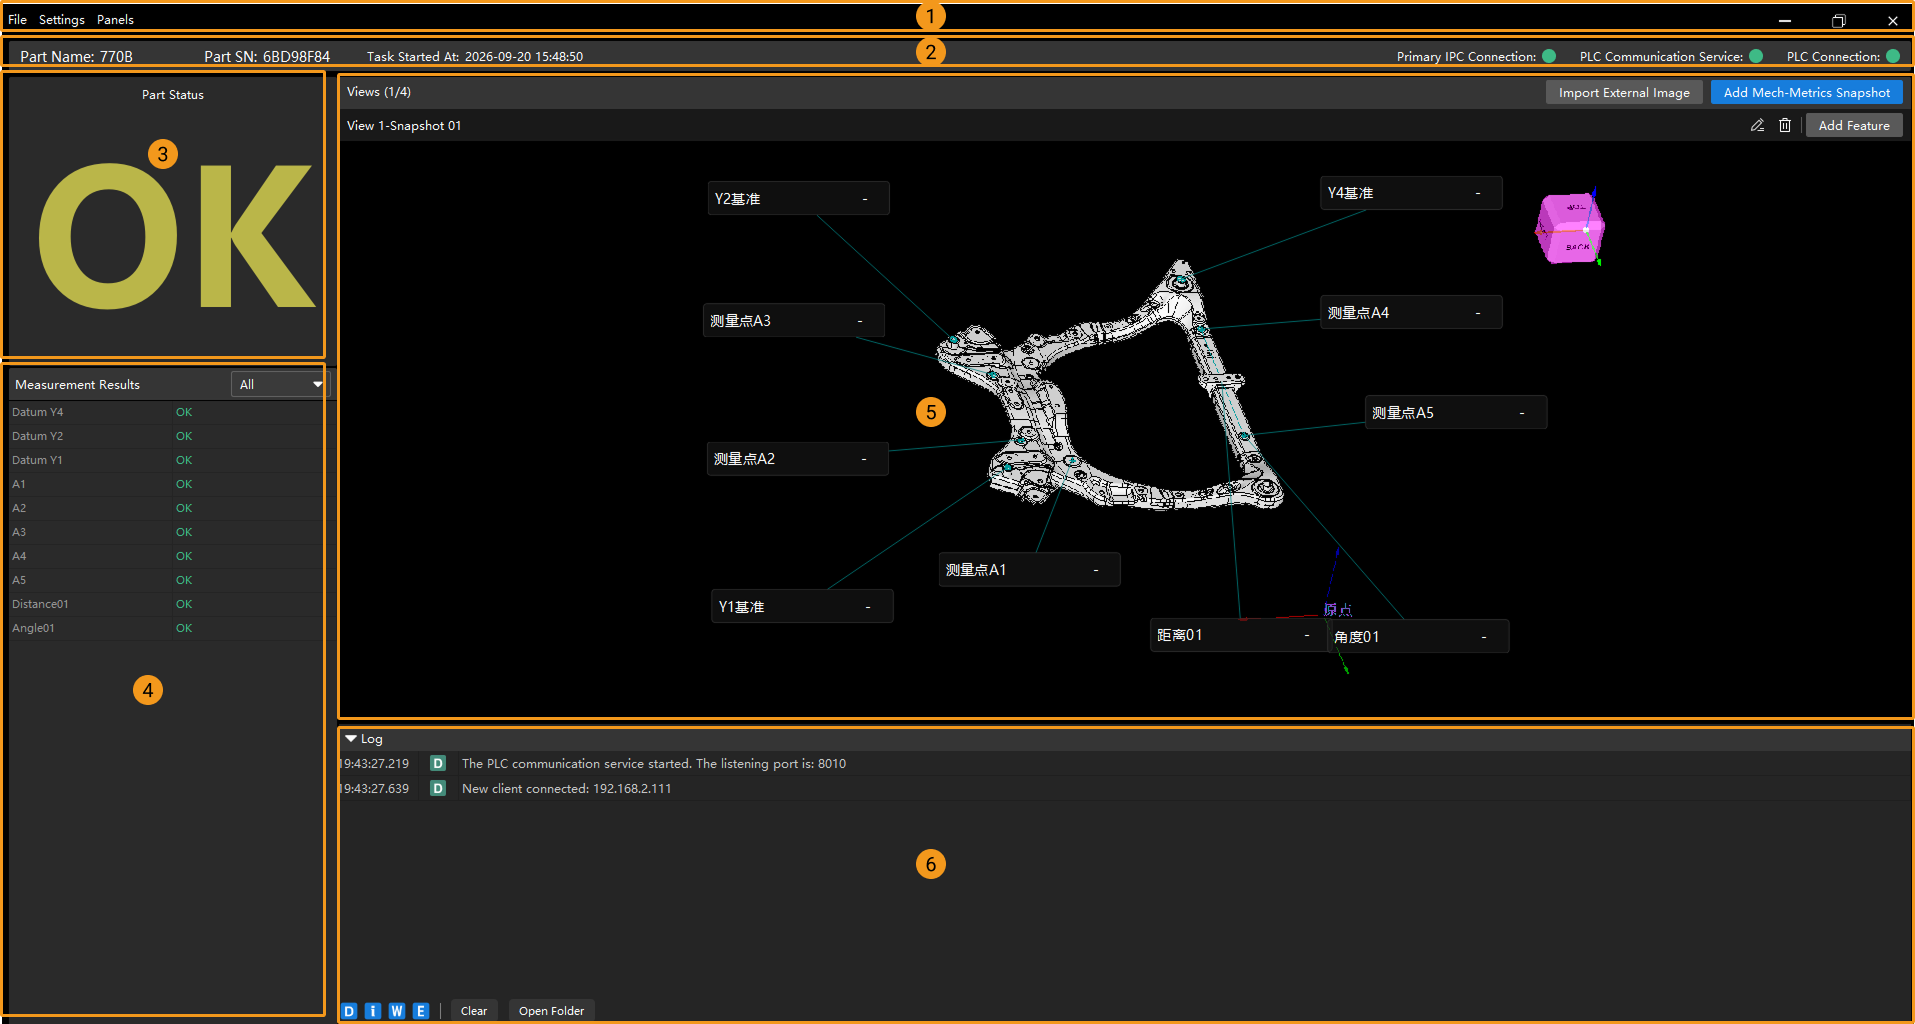
The following table describes the numbers and functions of the areas in the main interface.
| No. | Area | Description |
|---|---|---|
① |
Menu bar |
Provides the File, Settings, and Panels menus for configuration management, plugin settings, and panel display control. |
② |
Status bar |
Displays the status of the current part and the status of each connection. |
③ |
Judgment result |
Displays the judgment result of the current part. |
④ |
Measurement results |
Displays the measurement results of the features of the current part in a list. You can filter the results by All or NG. |
⑤ |
3D view |
Displays part snapshots or external images as views, and allows you to add feature annotations to the views. |
⑥ |
Log panel |
Records log information generated during plugin running. |
Menu Bar
The Menu bar contains three menus: File, Settings, and Panels.
Under the File menu, you can perform the following operations:
-
Click the New Configuration menu item to create a configuration.
-
Click the Open Configuration menu item to open a saved configuration.
-
Click the Edit Configuration menu item to modify the name, save path, primary IPC connection information, and part name of the current configuration.
-
Click the Save Configuration menu item to save the current configuration.
-
Click the Close Configuration menu item to close the current configuration and return to the start page.
If the current configuration contains unsaved changes, a confirmation dialog box will pop up. You can click Save to save the changes and close the configuration, click Don’t Save to discard the changes and close the configuration, or click Cancel to cancel this operation.
Under the Settings menu, you can perform the following operations:
-
Click the Options menu item to open the Settings dialog box and configure the common and display settings of the plugin. For details, see Options.
-
Select Auto-start on boot up, and the Repair Viewer will start automatically when the system boots up.
-
Click the PLC Communication Service Settings menu item to open the PLC Communication Service Settings dialog box. For detailed operations on starting the PLC communication service, see Start the PLC Communication Service.
Under the Panels menu, you can show or hide the Status bar, Judgment result, Measurement results, and Log panels.
Status Bar
In the Status bar, you can view the status of the current part and the status of each connection, including:
-
Part Name
-
Part SN
-
Task Started At
-
Primary IPC Connection Status
-
PLC Communication Service Status
-
PLC Connection Status
Judgment Result
You can view the judgment result of the current part (OK or NG) in the Judgment result panel.
Measurement Results
The measurement results of the features of the current part are displayed in a list in the Measurement results panel.
You can click All or NG to display all features or only the non-conforming features, so that you can quickly locate the areas that require repair.
3D View
In the 3D view, part snapshots or external images are displayed as views, and you can add feature annotations to the views as a reference for repair operations.
For detailed operations on adding views and feature annotations, see Add Views and Feature Annotations.
Log Panel
In the Log panel, log information generated during plugin running is recorded, including time, level, source, and message.
In the log panel, you can perform the following operations:
-
Click Copy to copy the selected logs.
-
Click Clear to clear the currently displayed logs.
-
Click Open Folder to open the log folder and view historical logs.
Options
Click in the menu bar to open the Settings dialog box. The left side of this dialog box contains two navigation items: Common and Display.
|
Settings marked with an asterisk (*) after their names take effect after the plugin is restarted. |
Common
The Common section is used to configure the basic behavior of the plugin and contains the following settings:
-
Language*: Sets the plugin interface language.
Display
The Display section is used to configure the font size in the plugin and contains the following settings:
-
Font size: Sets the font size of the Judgment result, Measurement result, and Annotation card respectively. You can drag the slider to adjust it. Click Reset to restore the font size of each area to the default value.