User Interface
This section briefly introduces the main interface layout and functional areas of Mech-Metrics, helping users become familiar with the basic entry points of each module.
Welcome Interface
After downloading Mech-Metrics, open the software to enter the welcome interface, as shown below.
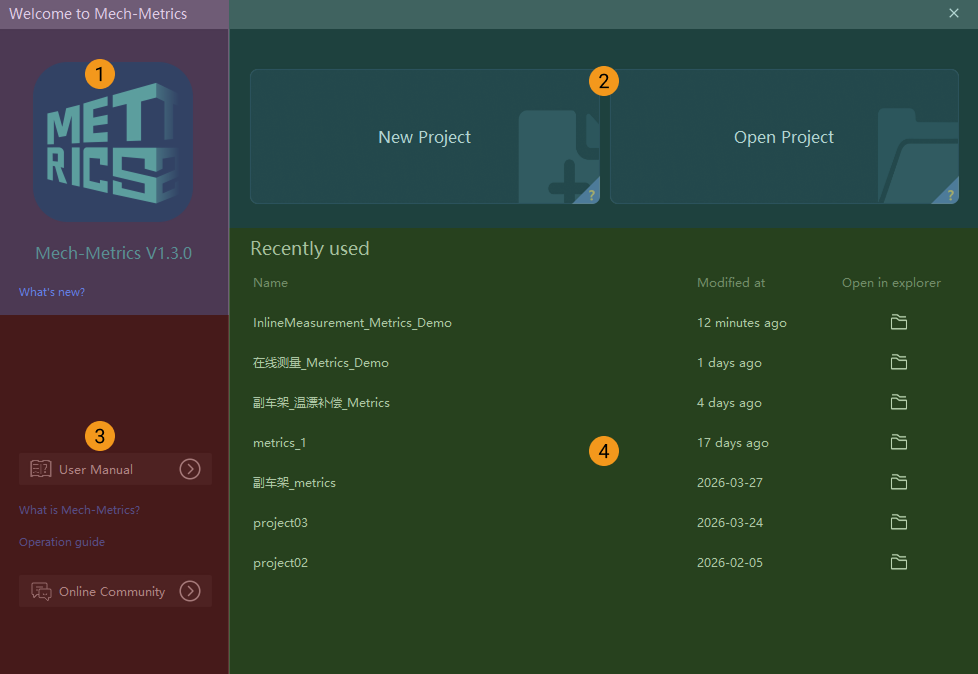
The welcome interface contains the following parts.
| No. | Area | Description |
|---|---|---|
1 |
Version information |
View version information and release notes. |
2 |
Quick entry |
Create a project or open an existing project. Hover over the "?" in the lower-right corner of a card to view its introduction. |
3 |
User manual and online community |
Click the corresponding buttons to browse the Mech-Metrics user manual or access the online community for questions and discussion. |
4 |
Recently used |
Open recently used projects. |
Main Interface
After you create a project in the Welcome interface, you enter the main interface of Mech-Metrics. From top to bottom, the main interface consists of the following parts:
-
Menu bar
-
Configuration interface
-
Production interface
-
Log panel
The following sections introduce each part in detail.
Menu Bar
The Menu bar does not change when switching between the Configuration interface and the Production interface. In the menu bar, users can modify project-wide and software-wide general settings.
The Menu bar is shown below.
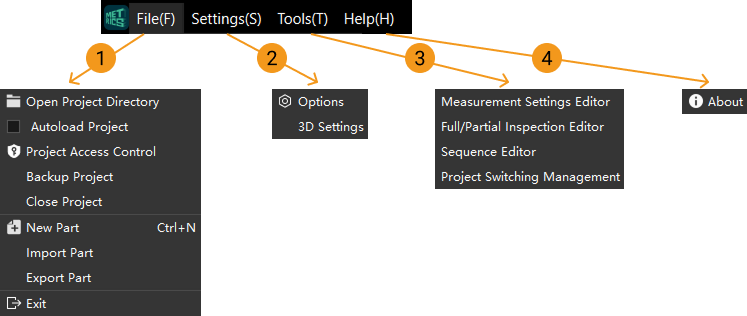
The following table lists commonly used menus in the Menu bar and their functions.
| No. | Menu | Description |
|---|---|---|
1 |
File |
Under the File menu, you can perform the following operations:
|
2 |
Settings |
Click Options to open the Settings dialog box and configure the common, display, and advanced settings of the software. For more information, refer to Settings Dialog Box. |
3 |
Tools |
The Tools menu provides the auxiliary tools of the software. Under the Tools menu, you can perform the following operations:
|
4 |
Help |
Under the Help menu, you can perform the following operations:
|
Settings Dialog Box
Click in the menu bar to open the Settings dialog box. The left side of this dialog box contains three navigation items: Common, Display, and Advanced, which are used to configure the software settings by category.
| Settings marked with an asterisk (*) after their names take effect after the software is restarted. |
Common
The Common section is used to configure the basic behavior of the software and contains the following settings:
-
Auto-start on boot up: If selected, the software will start automatically when the system boots up.
-
Close window to: Sets the behavior when the window is closed. You can select Minimize to tray or Exit Mech-Metrics.
-
Software start interface*: Sets the interface to enter after the software starts. You can select Configuration or Production.
-
Log expires after: Sets the number of days for keeping logs. Logs older than this number of days will be automatically cleaned up.
-
Language*: Sets the software interface language.
Display
The Display section is used to configure the font size, decimal places, and 3D display effects in the software and contains the following settings:
-
Font size: Sets the font size of the Judgment result, Measurement result, and Annotation card respectively. You can drag the slider to adjust it.
-
Decimal places:
-
Common decimal places: Show numbers as 1,234,567 or 1,234,567.89 depending on the decimal places.
-
Report decimal places: Show numbers as 1,234,567 or 1,234,567.89 depending on the decimal places.
Decimal places affect display only. Calculation and judgments are unaffected. -
-
3D display settings:
-
Axis size: Sets the size of the coordinate axes in the 3D view.
-
Axis title font size: Sets the font size of the coordinate axis titles in the 3D view.
-
Part brightness: Sets the display brightness of the part in the 3D view.
-
Advanced
The Advanced section is used to configure historical data evaluation and runtime data settings and contains the following settings:
-
Tolerance evaluation method: Sets the tolerance used for historical data evaluation. The following options are available:
-
Use tolerances recorded at measurement: Uses the tolerances recorded when the measurement occurred to evaluate the historical data.
-
Re-evaluate with current project tolerances: Re-evaluates the historical data using the tolerances configured in the current project.
Measured values stay unchanged. Historical Data pages use this basis for judgments and analysis. Export Report keeps its own data source option. -
-
Runtime data path*: Sets the storage path of runtime data (logs, dumps, etc.).
Configuration Interface
In the Configuration interface, users can add features and configure measurement parameters. The Configuration interface is shown below.
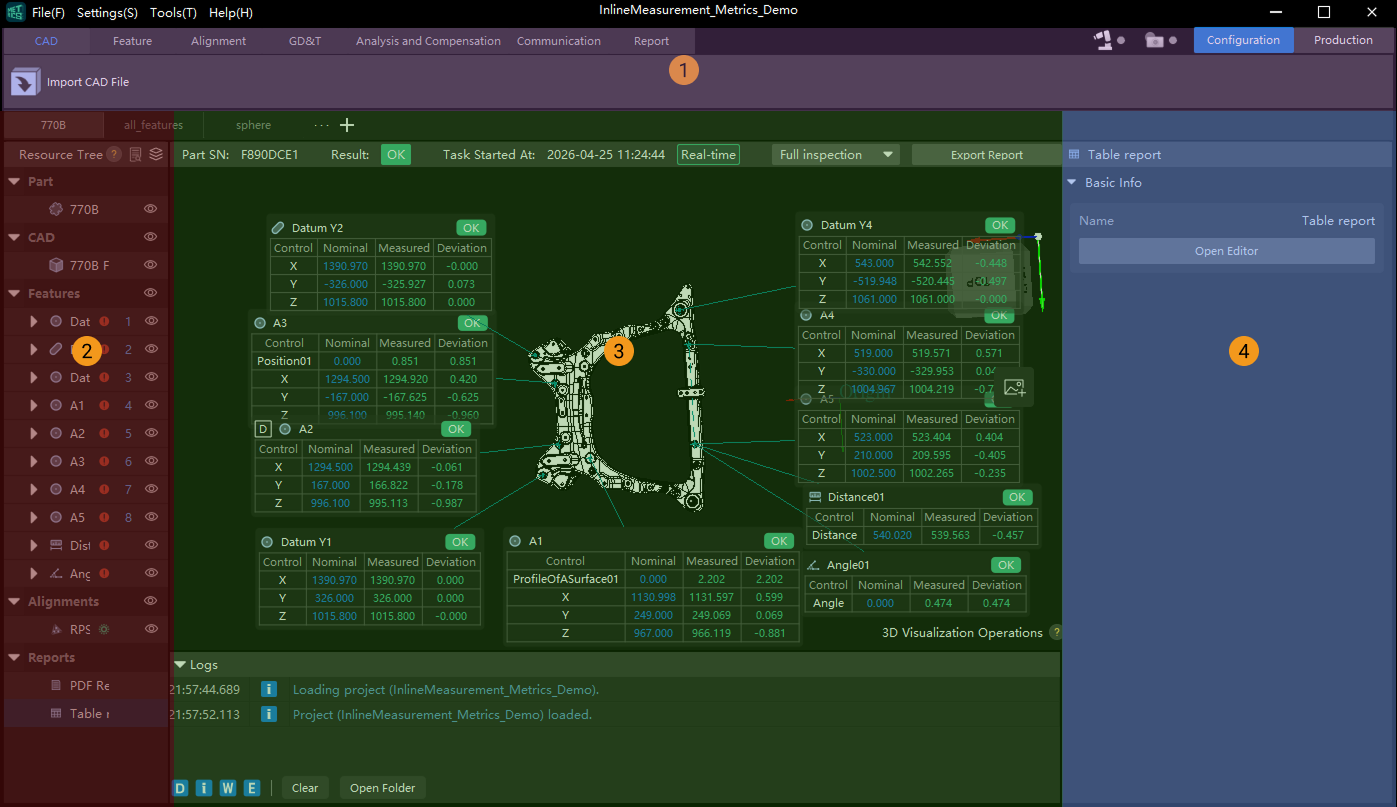
The following table lists common functions in the Configuration interface and their descriptions.
| No. | Area | Description |
|---|---|---|
1 |
Functional area |
The Functional area at the top brings together the core functions of the software. In this area, users can perform the following operations:
For more information, refer to Project Operation Guide. |
2 |
Resource tree |
The Resource tree on the left displays all resources of the current part in a centralized way, including the CAD model of the current part and all created features, reference frames, and custom report formats. Users can also show or hide resources in the resource tree as follows:
|
3 |
3D view |
The 3D view in the middle displays the imported CAD model of the current part, as well as created reference frames, features, annotation cards, distances, and other information in 3D. Users can also pick features and create snapshots in the 3D view. |
4 |
Parameter panel |
When users click any resource in the Resource tree on the left, related information is displayed in the Parameter panel on the right, including basic information, control items, and measurement results. Users can edit and modify some of this information in the parameter panel. |


Production Interface
In the Production interface, users can view and analyze detailed part data, but cannot add features or configure measurement parameters. The Production interface is shown below.
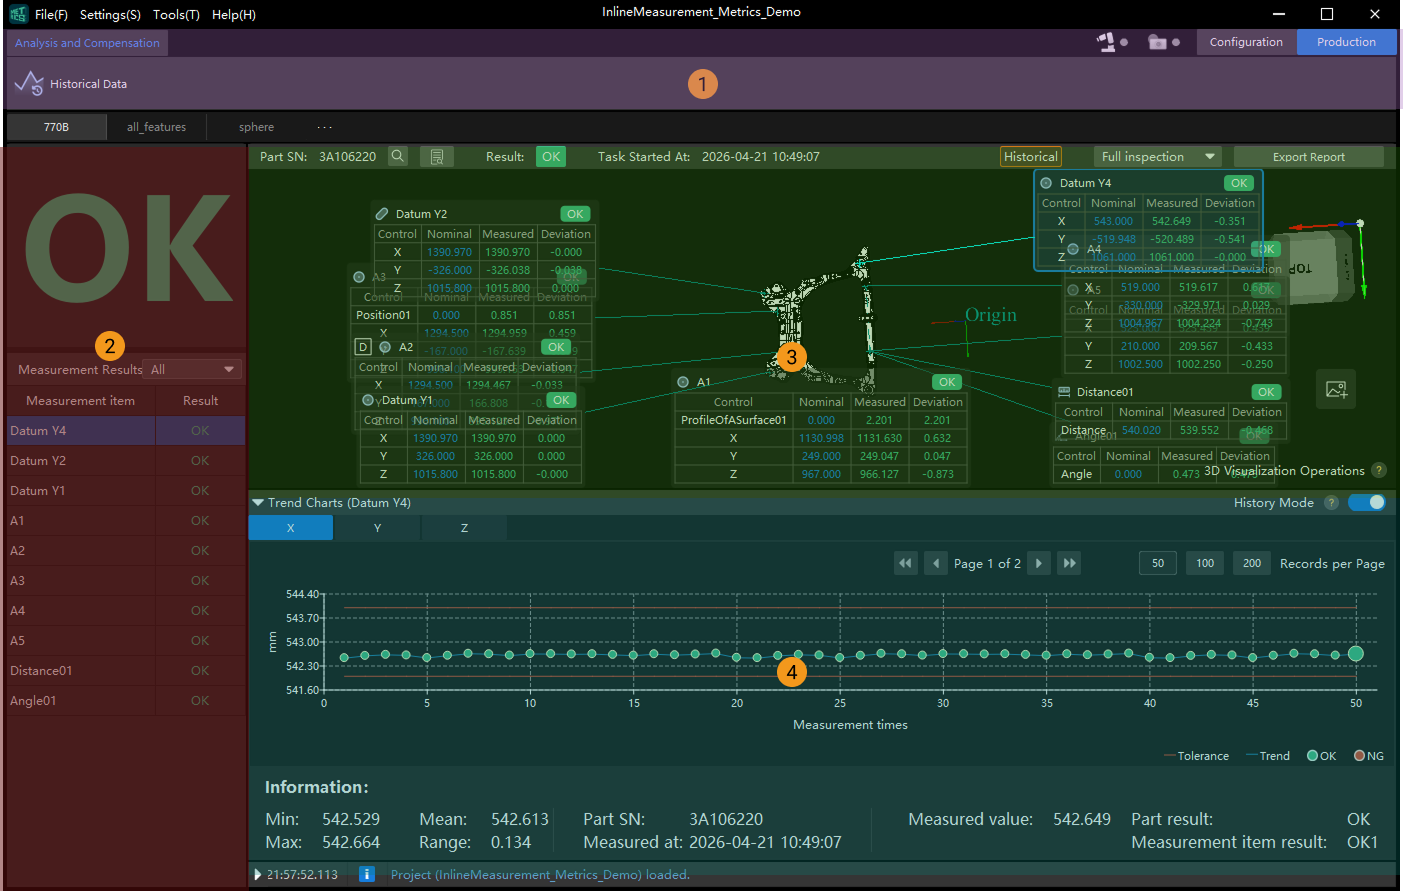
The following table lists commonly used functions in the Production interface. For more information, refer to Use Production Interface.
| No. | Area | Description |
|---|---|---|
1 |
Functional area |
In this area, users can perform the following operations: Analysis and Compensation tab: view, filter, and export historical data; perform Pareto chart analysis, SPC analysis, and trend chart analysis; and view raw data. |
2 |
Measurement results |
In this area, users can view measurement results for parts and features. |
3 |
3D view |
In this area, users can view configured CAD models, features, annotation cards, reference frames, distances, and more. Real-time measurement results are also displayed here. |
4 |
Trend chart |
In this area, users can view trends in measurement data as the number of measurements increases. |
Log Panel
The Log panel is located in the lower part of the software, as shown below. It records and prompts important user operations and measurement task status in the software. For example, after a user opens a project, the log panel displays Current project: xxx. If a user changes a setting, the log panel displays xxx modified. If a user performs an incorrect operation, the prompt logs shown in the Log panel can be used for troubleshooting.
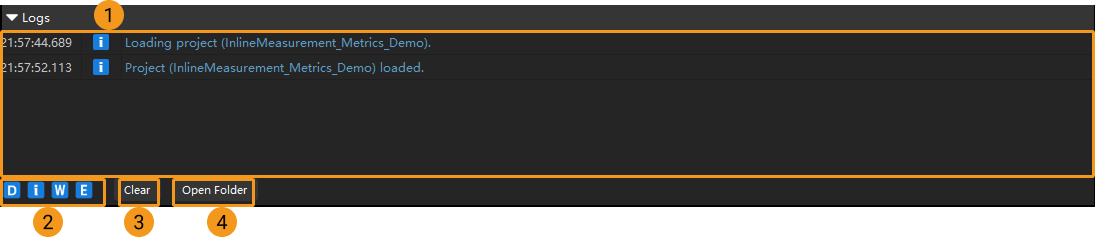
| No. | Button/Area | Description |
|---|---|---|
1 |
Log panel |
The log panel records all log information from the time a project is opened to the current operation. |
2 |
D i W E |
The four buttons D, i, W, and E are used to filter logs. Their meanings are as follows:
If any of these buttons is clicked and turns gray, logs of that type are no longer displayed. For example, if the D button is gray, debug logs are hidden. To troubleshoot errors, click D, i, and W in sequence so that only error logs are displayed in the log area. |
3 |
Clear |
Click Clear to clear all displayed logs in the log area. |
4 |
Open Folder |
Click Open Folder to view logs from recent days. Logs for each day are stored separately in a log file named by date. Users can click in the top menu bar to view the log expiration time and check the current number of days for which logs are retained. Users can also modify the retention period as needed. If an error occurs, users can check the log for the current day to troubleshoot the issue. |