Set Appropriate Thresholds for OK and NG Results
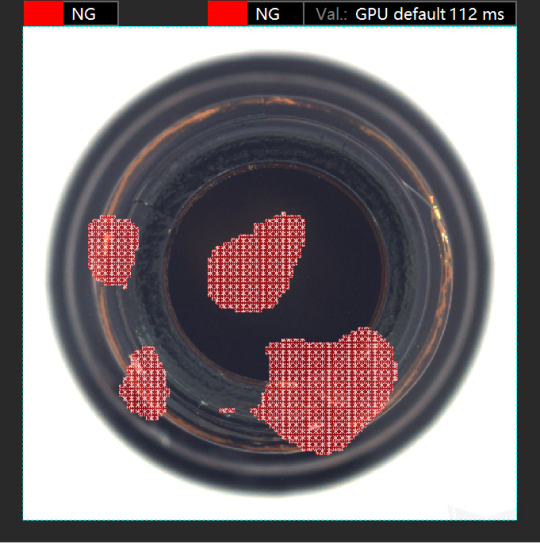
Once thresholds are set for the defect confidence chart, the Unsupervised Segmentation module can judge accordingly whether an image is OK, NG, or Unknown. In addition, a greater threshold of OK results indicates a smaller defect area identified by the algorithm. It is necessary to set appropriate thresholds for OK and NG results according to actual situations to obtain the optimal performance of the trained model.
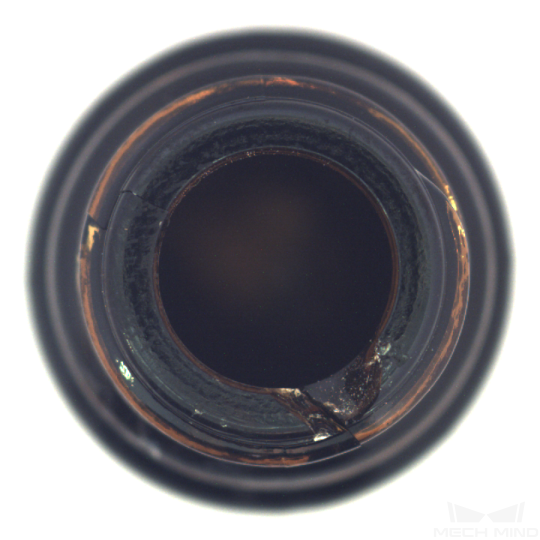
| Original image | Threshold of OK results: 0.10 | Threshold of OK results: 0.20 |
|---|---|---|
|
|
|
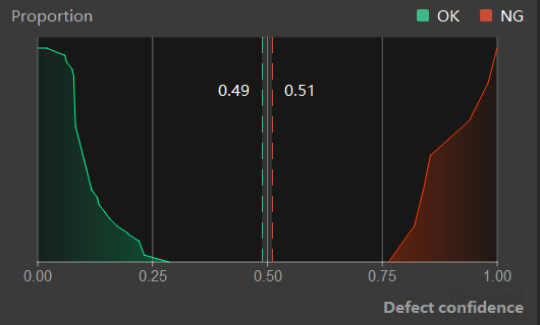
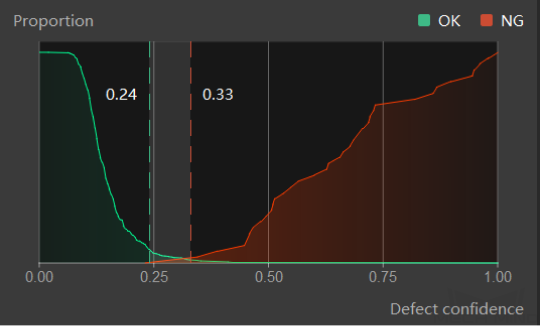
In the defect confidence chart, the y-coordinate of the green curve stands for the ratio of the number of OK images with defect confidence lower than the set threshold of OK results to the total number of OK images. The y-coordinate of the red curve stands for the ratio of the number of NG images with defect confidence greater than the set threshold of NG results to the total number of NG images. If the two curves do not intersect, the OK and NG images can be completely separated by thresholds. In other words, it is possible to leave no images labeled as Unknown. In this case, the farther apart the two lines are from each other, the better.
| Good result | Poor result |
|---|---|
|
|