Set Appropriate Thresholds for OK and NG Results
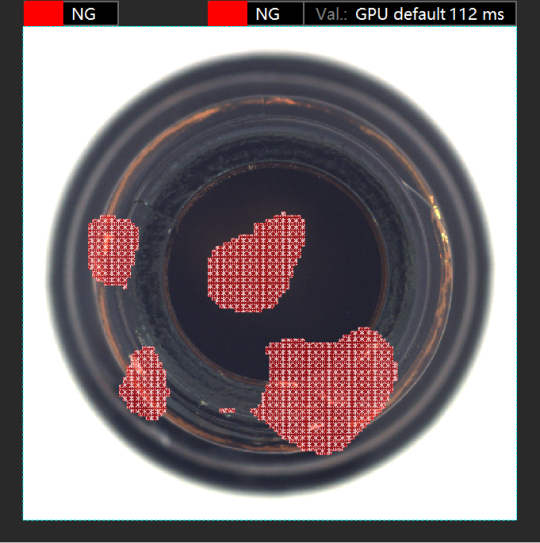
Once thresholds are set for the defect confidence chart, the Unsupervised Segmentation module can judge accordingly whether an image is OK, NG, or Unknown. In addition, a greater threshold of OK results indicates a smaller defect area identified by the algorithm. It is necessary to set appropriate thresholds for OK and NG results according to actual situations to obtain the optimal performance of the trained model.
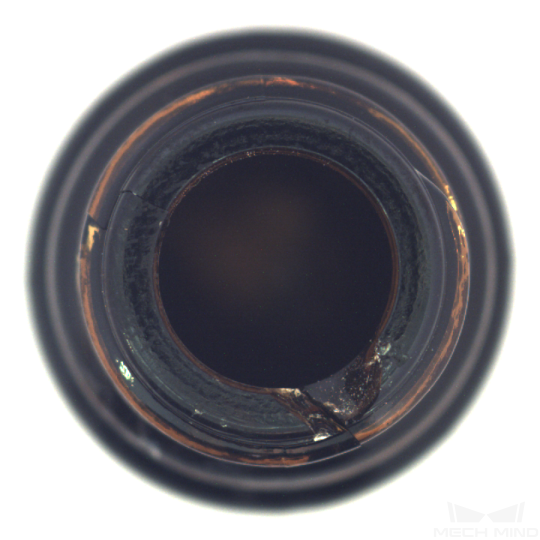
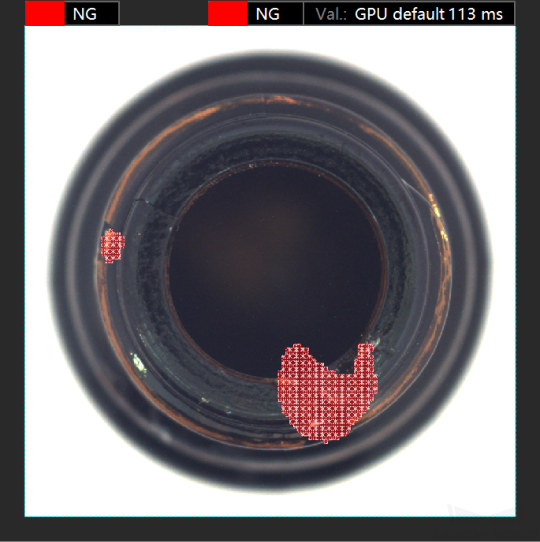
| Original image | Threshold of OK results: 0.10 | Threshold of OK results: 0.20 |
|---|---|---|
|
|
|
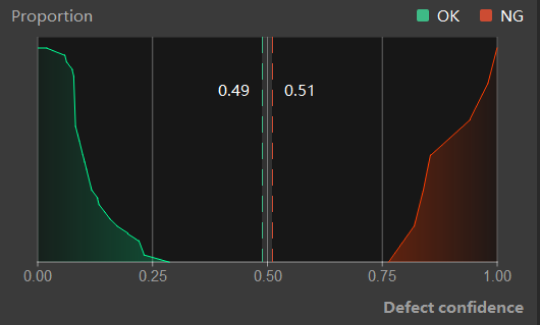
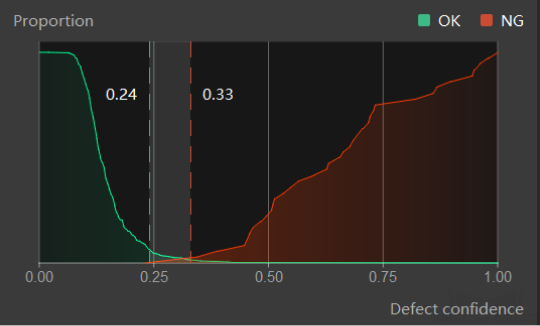
On the Validation tab, click the Edit button next to Confidence Chart to open the Adjust Thresholds dialog box. In the Adjust Thresholds dialog box, the vertical axis of the green curve represents the proportion of OK images in the validation set whose defect scores are higher than the defect score on the horizontal axis, among all OK images. The vertical axis of the red curve represents the proportion of NG images in the validation set whose defect scores are lower than the defect score on the horizontal axis, among all NG images. If the two curves do not intersect, the OK and NG images can be completely separated by thresholds. In other words, it is possible to leave no images labeled as Unknown. In this case, the farther apart the two lines are from each other, the better.
| Good result | Poor result |
|---|---|
|
|