Validate a Model
After you train a model, you can validate it in the Validation tab. This topic describes how to configure validation parameters, validate models, and view the validation results.
Configure Validation Parameters
Click ![]() on the right side of Validation Parameter Settings to open the Validation Parameter Settings window.
on the right side of Validation Parameter Settings to open the Validation Parameter Settings window.
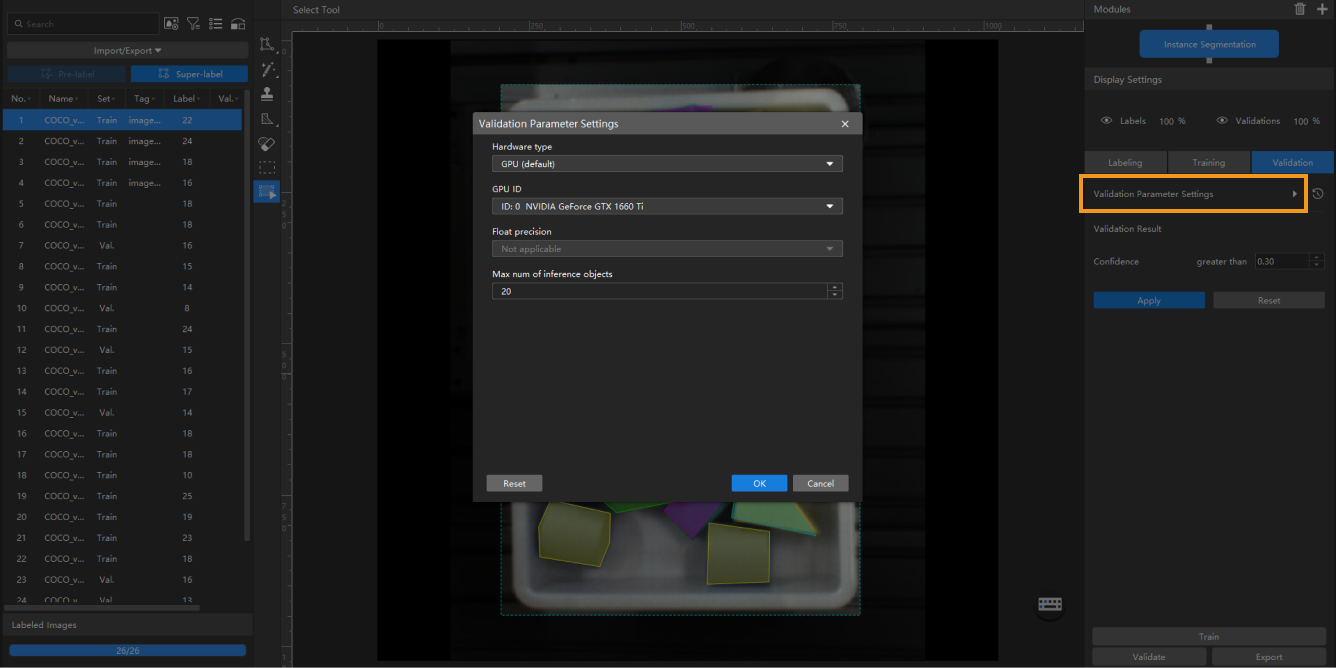
You can configure the following parameters:
-
Hardware type
-
CPU: Use CPU for deep learning model inference, which will increase inference time and reduce recognition accuracy compared with GPU.
-
GPU (default): Do model inference without optimization based on the hardware, and the model inference will not be accelerated.
-
GPU (FP16 optimization): Do model inference with FP16 precision optimization based on the hardware, requiring only one optimization (about 5–15 minutes). It is suitable for scenarios with high requirements for model inference speed.
-
GPU (FP32 optimization): Do model inference with FP32 precision optimization based on the hardware, requiring only one optimization (about 5–15 minutes). It is suitable for scenarios with high requirements for model recognition accuracy.
-
-
GPU ID
The graphics card information of the device deployed by the user. If multiple GPUs are available on the model deployment device, the model can be deployed on a specified GPU.
-
Max num of inference objects (only visible in the Instance Segmentation module and Object Detection module)
The maximum number of inference objects during a round of inference.
Validate a Model
After you configure the parameters, click OK to save the settings. On the lower part of the Validation tab, click the Validate button and wait for the validation to complete.
View the Validation Results
-
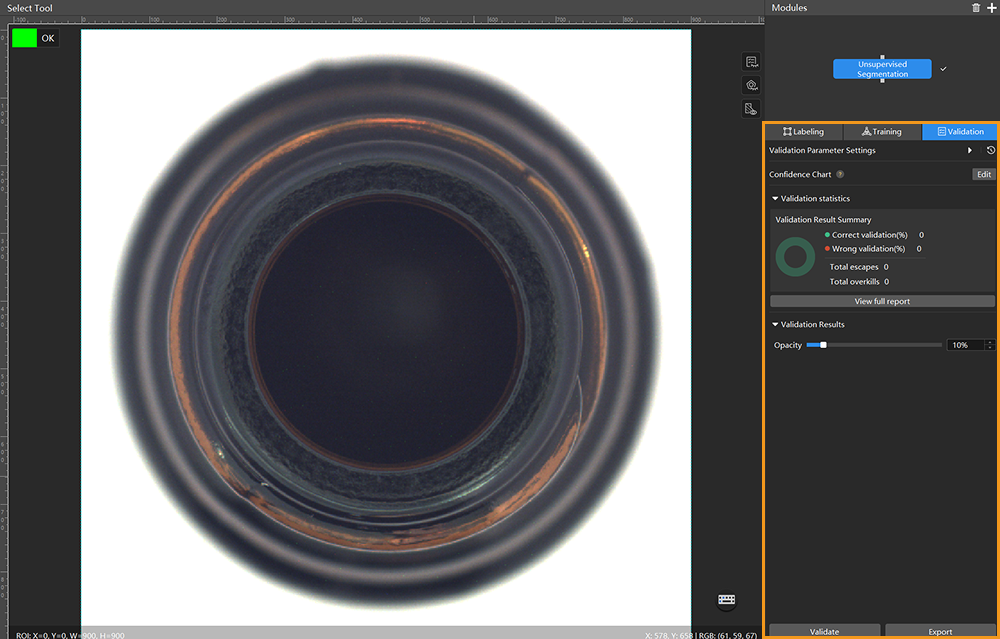
After the validation is completed, you can view or filter the validation results in the Validation tab.
-
Click View full report to open the detailed report window. In the bottom-right corner of the window, click the Export report button to export the detailed report to your local device.
For Instance Segmentation, Defect Segmentation, Classification, Object Detection, Text Detection, Unsupervised Segmentation, Pick Anything V2, and Object-Bin Segmentation modules, the following operations can be performed:
-
After validation is complete, you can view the validation result quantity statistics in the Validation statistics section under the Validation tab.
-
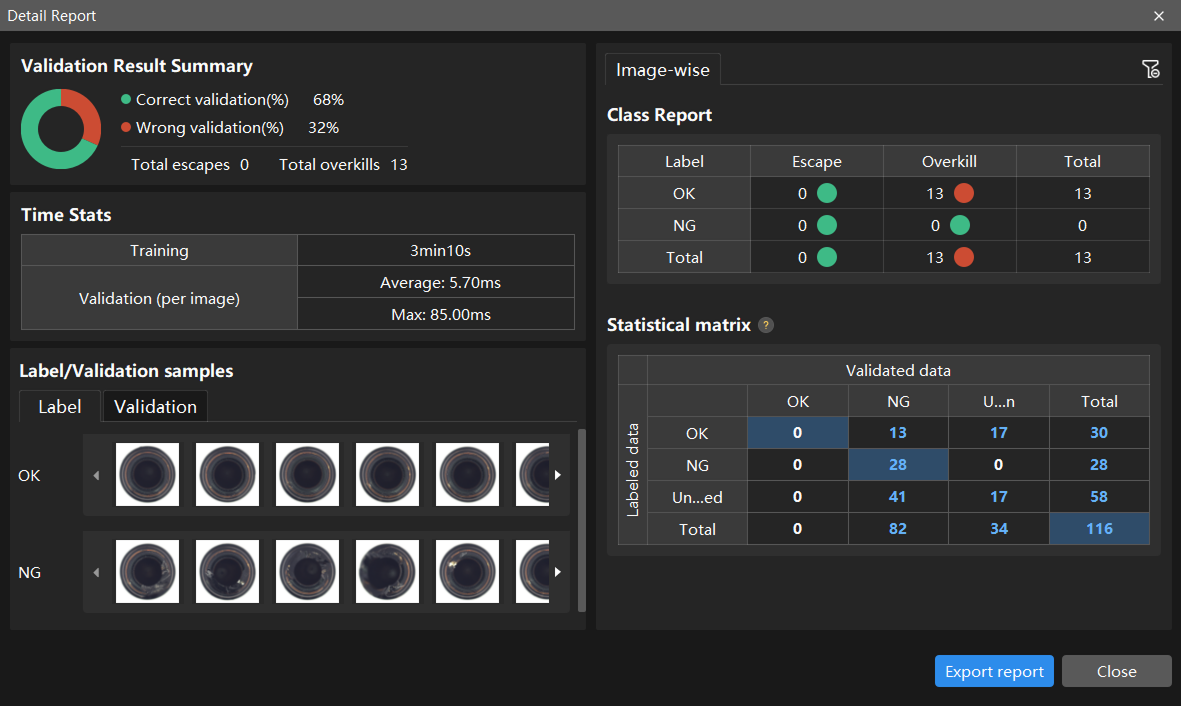
Click the View full report button to open the Detailed Report window and view detailed validation statistics.
-
The Statistical matrix in the report shows the correspondence between the validated data and labeled data of the model, allowing you to assess how well each class is matched by the model.
-
In the matrix, the vertical axis represents labeled data, and the horizontal axis represents predicted results. Blue cells indicate matches between predictions and labels, while the other cells represent mismatches, which can provide insights for model optimization.
-
Clicking a value in the matrix will automatically filter the image list in the main interface to display only the images corresponding to the selected value.
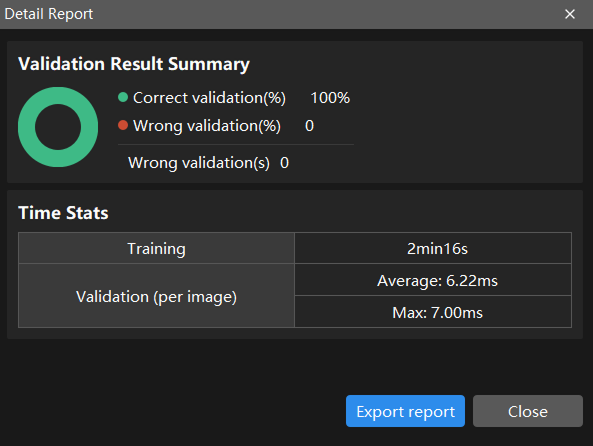
For the Text Recognition module, the following operations can be performed:
You can view the validation result quantity statistics and time consumption statistics in the Detailed Report window.
-