Collect Information about the Issue
Collect Information about Camera Issues
When an issue occurs in the camera and it cannot be troubleshot by “FAQs and Solutions”, the following information typically needs to be collected:
-
Real scenario
-
Camera serial number
The camera serial number (SN) is printed on the label attached to the camera. It is the unique identification number of each camera. For the camera serial number, please refer to How to Read Camera Serial Number?.
-
Power supply for the camera
Mech-Mind provides two power supply options: a 24V DC power supply solution (DIN rail power supply) and a power adapter.
-
Camera mounting mode
There are two common camera mounting modes: Eye in Hand (EIH) and Eye to Hand (ETH). EIH refers to the setup where the camera is installed on the flange located on the end of the robot. ETH refers to the setup where the camera is installed on a bracket independent from the robot.
-
Issue categories (camera connection, projector, image capturing, point cloud quality, etc.)
Collect Information about IPC Issues
When an issue occurs in the IPC, the following information typically needs to be collected:
-
IPC model and number (if a Mech-Mind standard IPC is used)
-
Description
-
Error codes (when encountering a blue screen)
-
System logs of IPC
Follow these steps to export the system logs of IPC:
-
In IPC, press Windows + X to open the Event Viewer.
-
In the Event Viewer window, select .
-
In the right-side Actions panel, click Save All Events As... to export all system logs.
-
(Optional) If you only need to export logs for unexpected shutdowns, in the right-side Actions panel, click Filter Current Log. In the Filter Current Log dialog, enter the unexpected shutdown event ID (6008), and then click OK. In the right-side Actions panel, click Save Filtered Log File As... to save the filtered log file.
-
Collect Information about Vision Issues
For non-hardware issues, maintenance personnel should collect the following information:
-
Symptoms
When an issue occurs, please describe its symptoms and the conditions in which it occurs, and provide screenshots of warnings or exceptions.
-
Software running environment and configuration
You should provide information about the running environment and configuration of the software when the issue occurs:
-
Software name and version: Provide the name and version of the software with issues. Find the version number by selecting Help > About.
-
Camera model, serial number, firmware version, and mounting mode: Provide information about the model, ID, firmware version, and mounting mode of the camera related to the fault.
-
IPC specifications: If the issue is related to the IPC, provide information about the IPC’s hardware configuration.
-
IPC language and region setting: If the issue is related to the IPC, provide the operating system version of the IPC. For issues related to multi-lingual display, provide information about the IPC’s current language and region settings.
-
Software language: For issues related to multi-lingual display, provide information about the software’s language setting.
-
Project: If the project cannot run normally or as expected, please provide the project that can be used for simulation (including project data and deep learning data).
-
-
Log
Collect Mech-Mind software logs. Please refer to Collect Software Logs for detailed contents.
-
.dmp Files
A .dmp file can be understood as a memory image of a software process. A complete .dmp file saves information such as the program’s memory, stack, handles, threads, and other related data, which can help you understand the reasons behind a malfunction and find suitable solutions.
For details on how to collect .dmp files, please refer to Collect .dmp Files.
Collect Software Logs
Collect Mech-Eye Viewer Logs
Method I: Please collect the camera logs by following the steps below:
-
Open Mech-Eye Viewer and connect the camera.
-
Click Show Log in the data acquisition area to open the log saved in the camera.
-
Click Show Log Entries in the lower right to display the full log list.
-
Select the log file (.log) from the date when the issue occurs, and then click Export.
Method II: Open the \logs folder under the Mech-Eye SDK installation directory in File Explorer, and find the log file (.log) of the date when the issue occurs.
Collect Mech-Vision Logs
Method I: Open Mech-Vision, select Vision in the Log area, and click Open folder to find the log file (.log) of the date when the issue occurs.
Method II: Open the \logs folder under the Mech-Vision installation directory in File Explorer, and find the log file (.log) of the date when the issue occurs.
Collect Mech-Viz Logs
Method I: Start Mech-Viz, click Open folder in the Log functional panel, and find the log file (.log) of the date when the issue occurs.
Method II: Open the \logs folder under the Mech-Viz installation directory in File Explorer, and find the log file (.log) of the date when the issue occurs.
Collect Communication Component Logs
Method I: Open Mech-Vision, select Console in the Log area, and click Open folder to find the log file (.html) of the date when the issue occurs.
Method II: Open the \logs folder under the installation directory of the communication component in File Explorer, and find the log file (.html) of the date when the issue occurs.
Collect .dmp Files
| The software generates minidump files by default. After checking the “Generate file of debugging details (.dmp)” box in the “Options” window, fulldump files will be generated, which contain richer information and help to locate problems more accurately, but the generation time of fulldump files is longer than that of minidump files. |
Software Crash
When a software crash occurs, the method to collect .dmp files is as follows:
-
Check whether there are files with the suffix “.dmp” in the software’s installation directory.
-
If not, please check whether there are .dmp files in the “C:\%USERNAME%\USERNAME\AppData\Local\CrashDumps” path.
-
If no .dmp files are found according to the above steps, you can confirm the software crash time period based on the log file, and then use the Event Viewer and Reliability Monitor to view the software crash information recorded in the system log.
Use Event Viewer to View Crash Information
Follow the steps below to view crash information using the Event Viewer:
-
Use the shortcut key WIN + R to open the Run window.
-
Enter
eventvwrin the Run window, and then click OK to open the Event Viewer window. -
Save the “Application” and “System” logs and send them to Mech-Mind Technical Support.
Use Reliability Monitor to View Crash Information
Follow the steps below to view crash information using the Reliability Monitor:
-
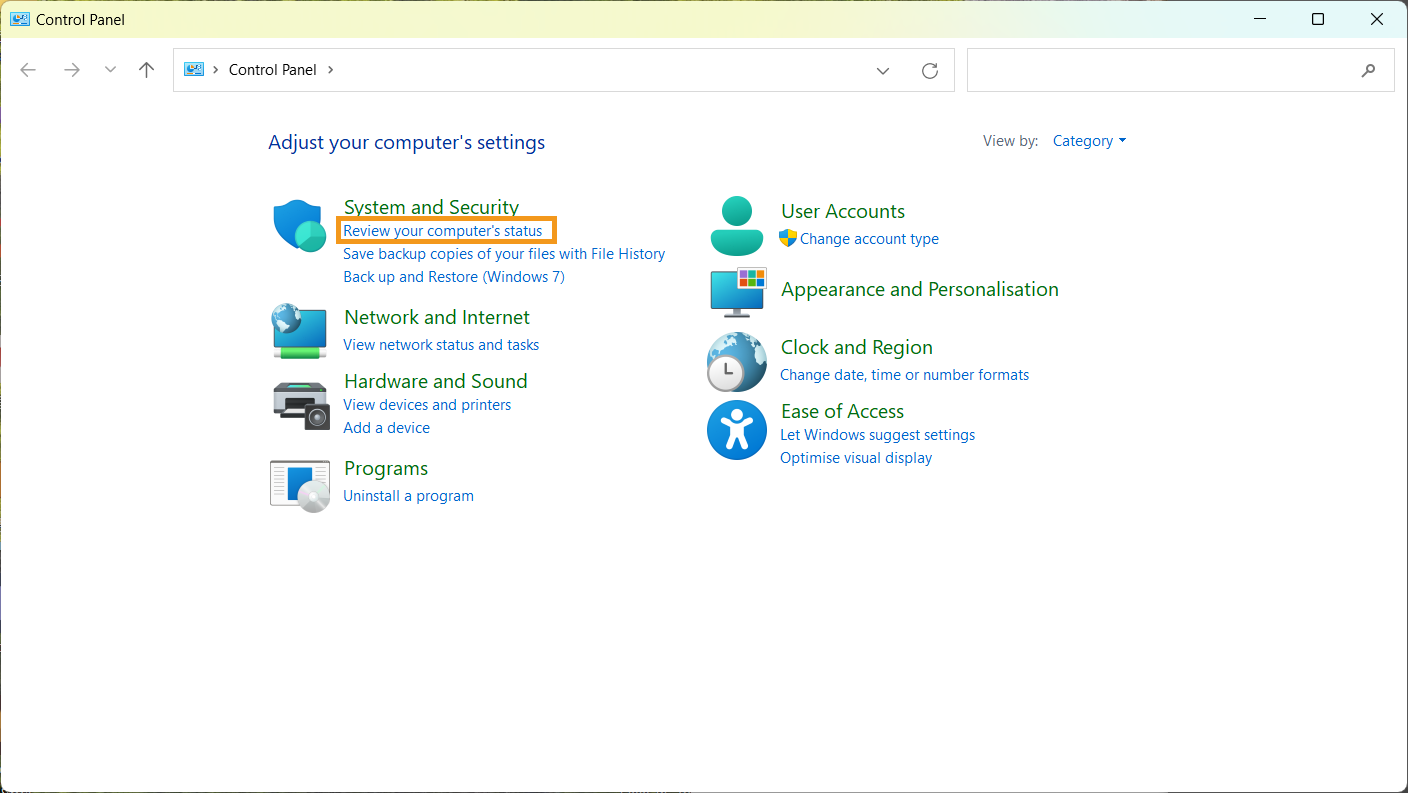
Open the Control Panel and clickReview your computer’s status.

-
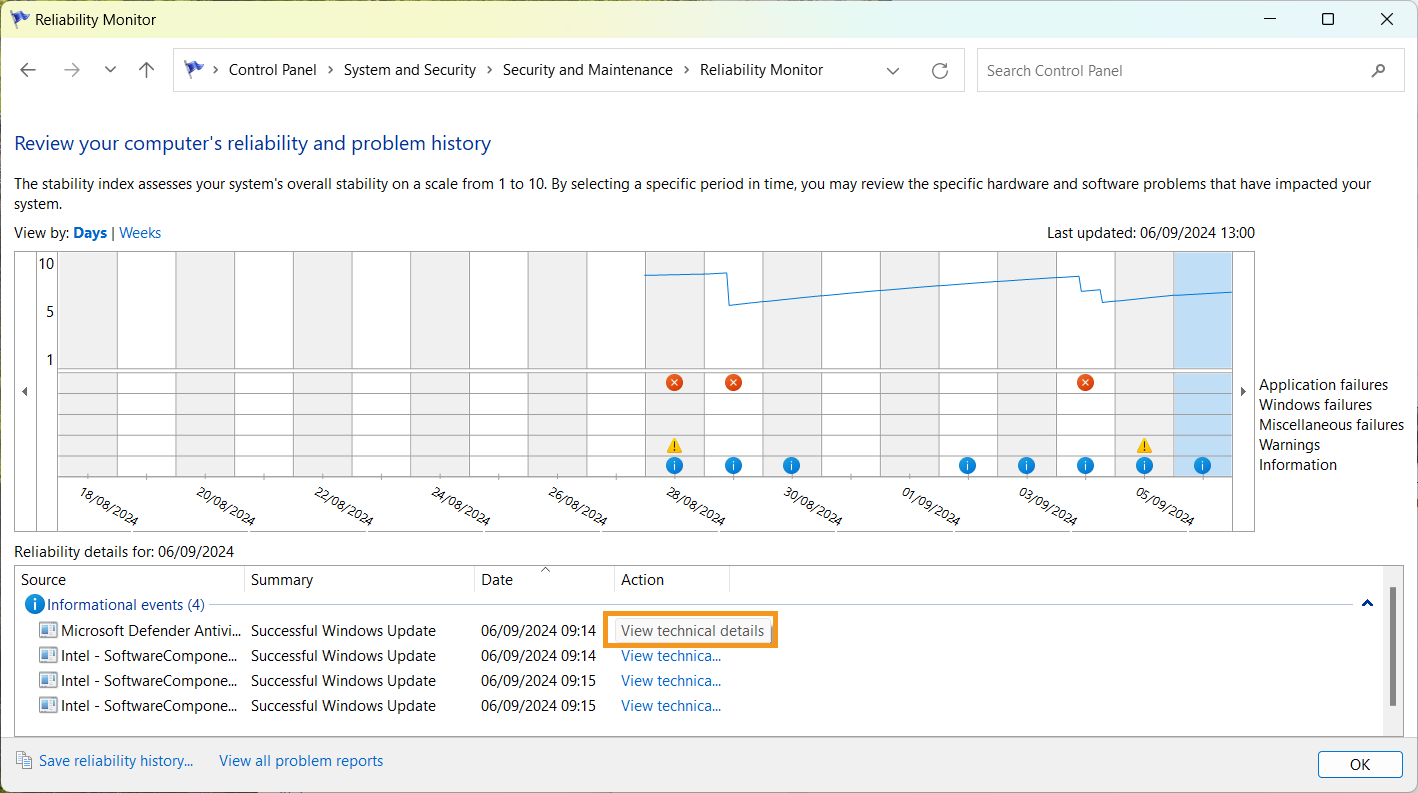
Click menu:Maintenance [View reliability history].

-
Find the critical events happened during the crash time period.
-
Right-click the corresponding critical event, and then click View technical details.

Exception Error in the Pop-up Window
When there is an exception error appeared in the pop-up window, the method to collect .dmp files is as follows:
-
Under normal circumstances, when an exception occurs in the software, the software will catch the exception and display the below pop-up window. Click Retry to generate the .dmp file corresponding to the crash.

-
In some cases (e.g. serious memory errors), the software cannot capture the exception, only the IPC’s operating system can capture it.
Software Freeze
When the software freezes, the method to collect .dmp files is as follows:
-
If the software freezes and does not respond, you can first open the software’s installation directory to check whether there are .dmp files. You can also check whether there are .dmp files in the system (in the path of C:\Users\%USERNAME%\AppData\Local\CrashDumps).
-
If there are no .dmp files, please create .dmp files.
Do not perform this operation while the software is running normally, otherwise it will result in excessive memory usage. -
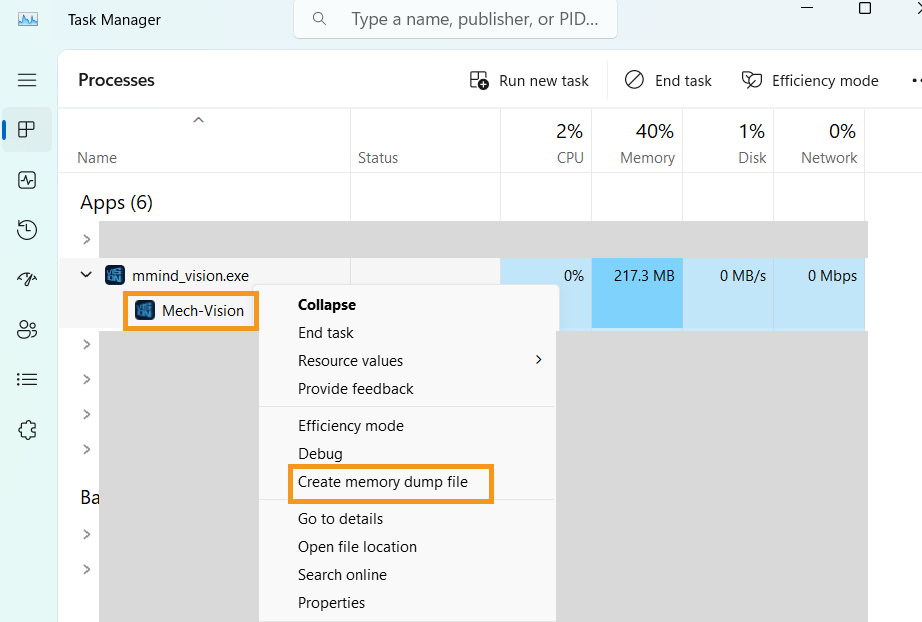
Open Task Manager and find the software.
-
Right-click the software and click Create dump file in the pop-up menu.

-
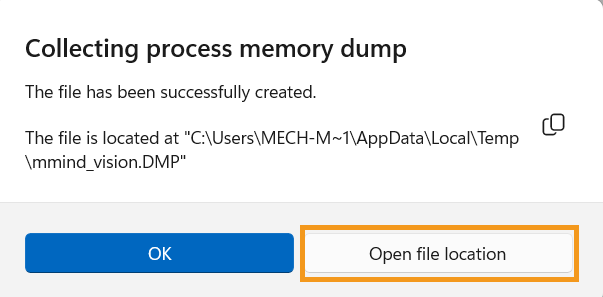
This process may take some time, please wait patiently. When the .dmp file is successfully created, click Open file location in the pop-up dialog box and find the created .dmp file.

-