Acquire and View Data
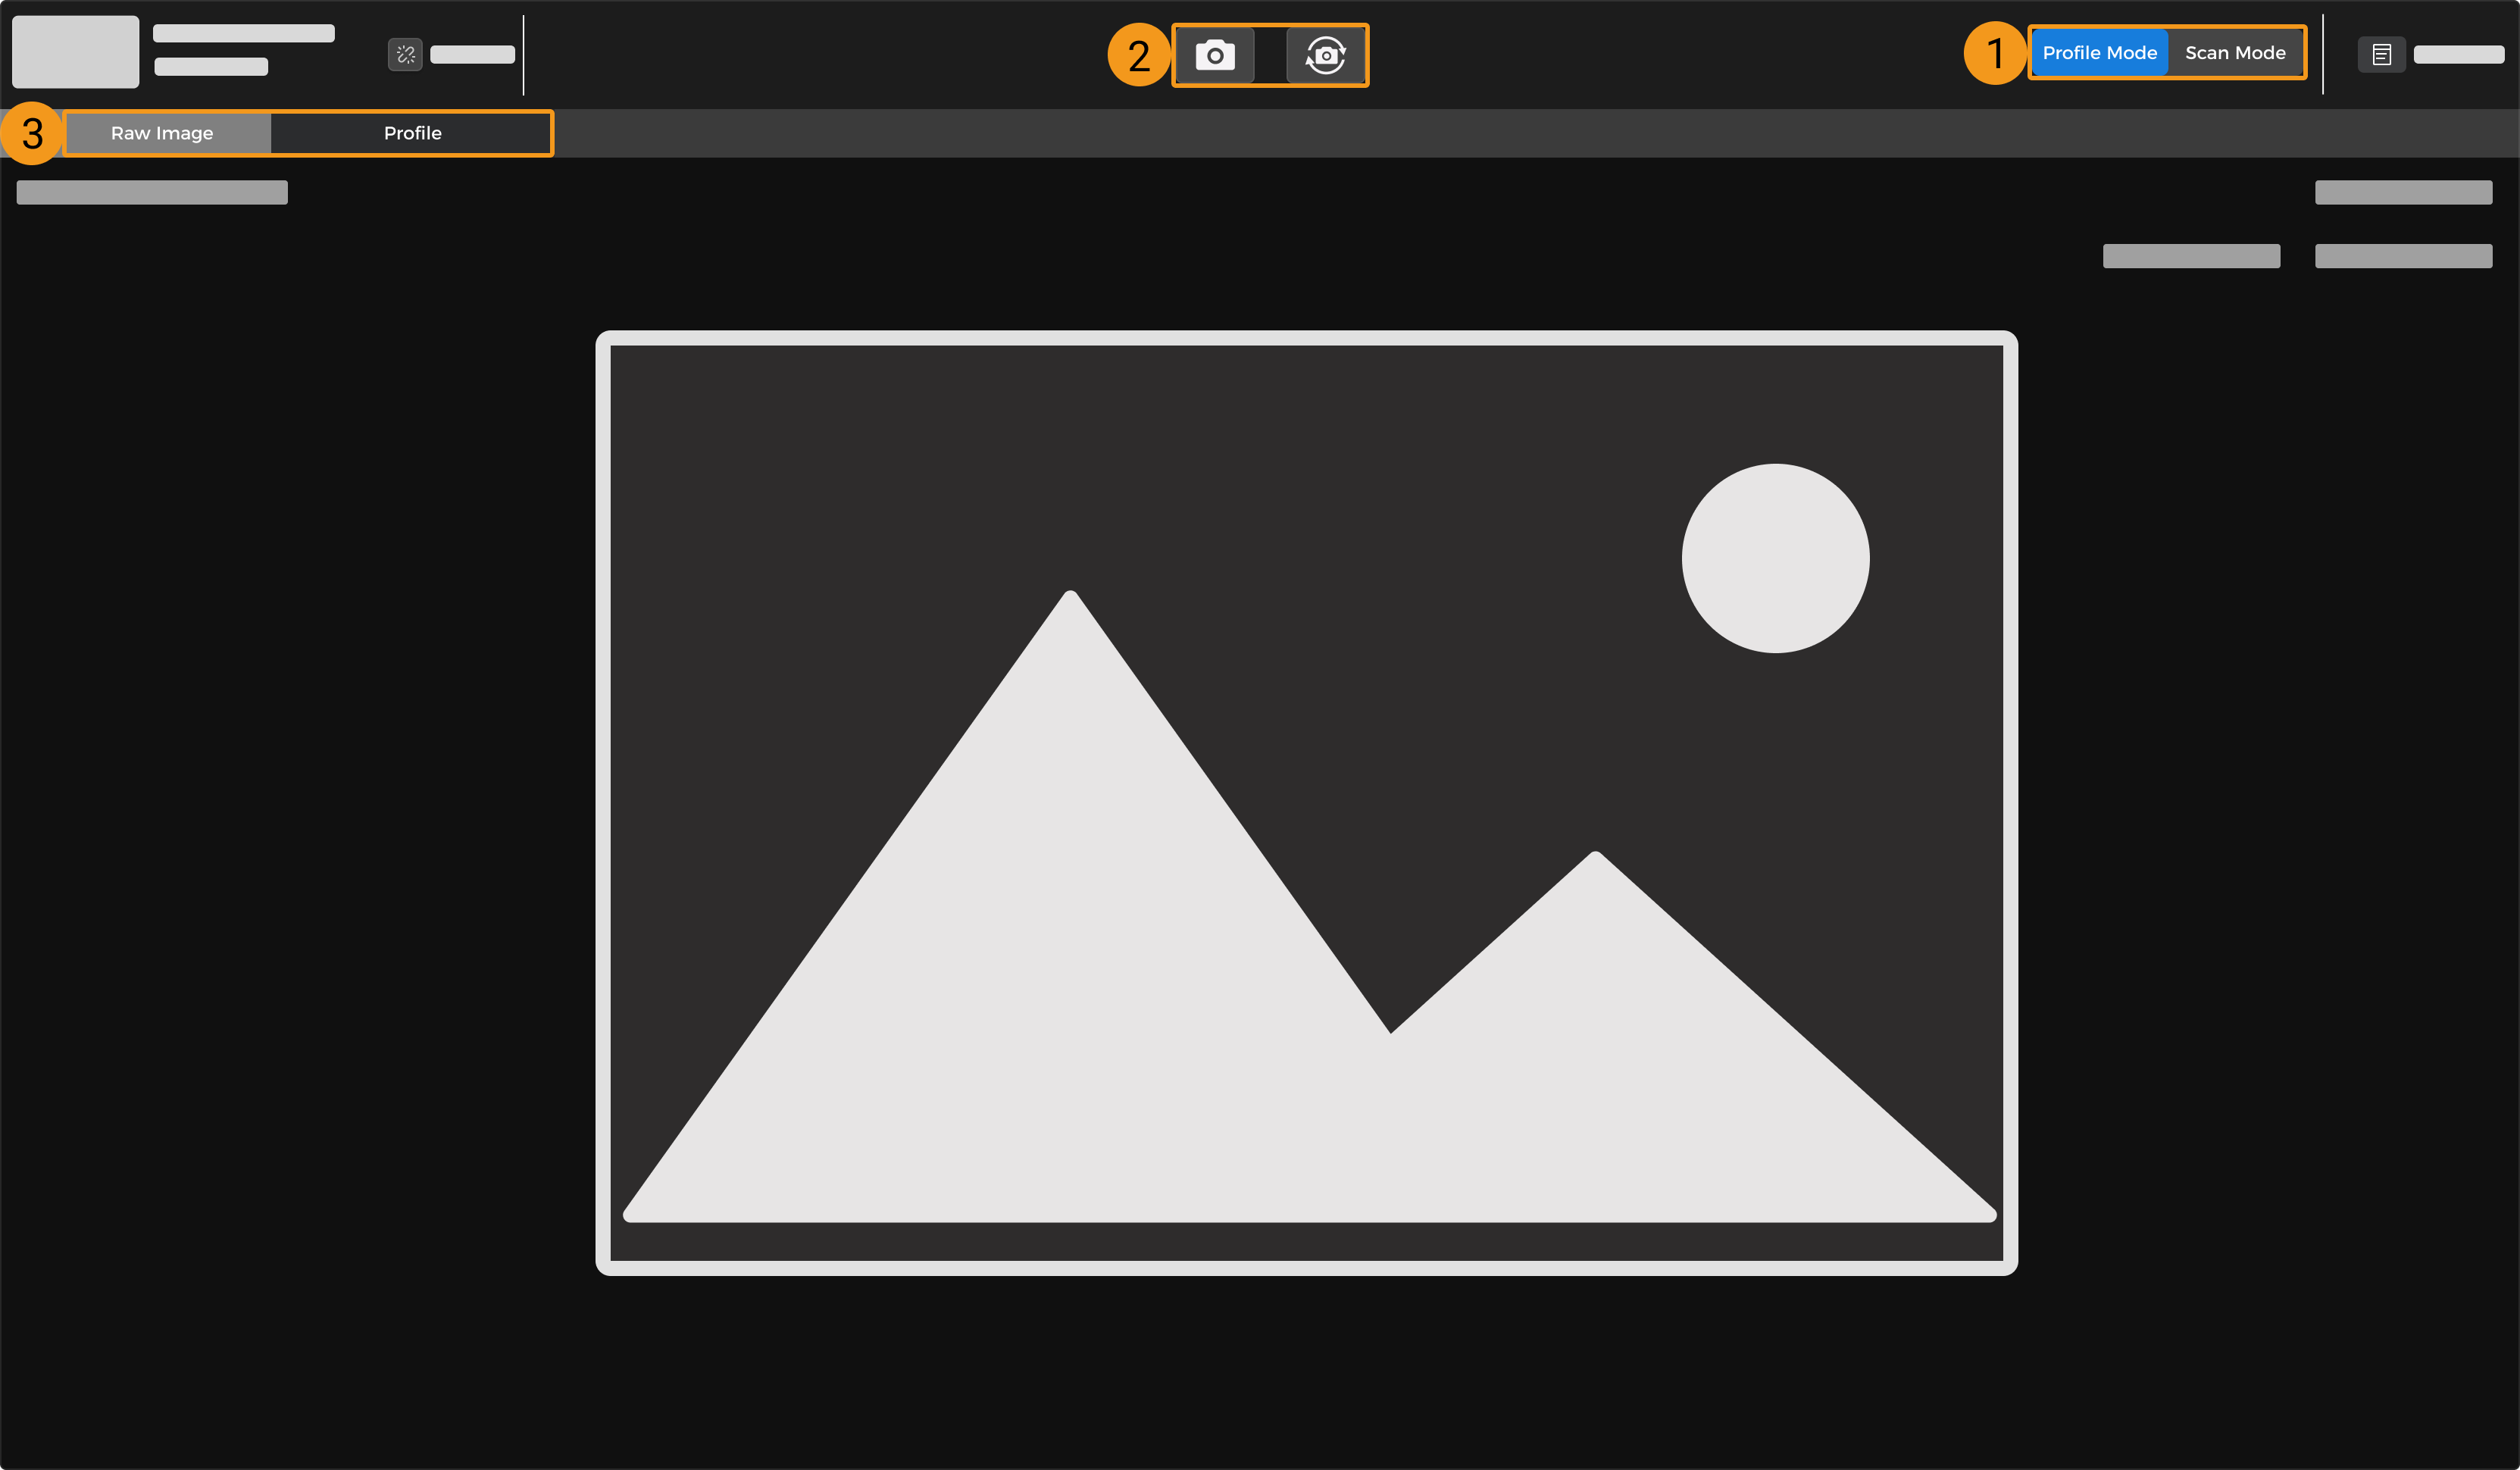
Once the laser profiler is successfully connected, the following interface is displayed. In this interface, you can switch the data mode, acquire data, and view the data.
-
Switch data mode
-
Acquire data
-
Switch data type
Switch Data Mode
Click the corresponding button to switch the data mode:
-
Profile mode: used to acquire the raw image and profile, and adjust the relevant parameters.
-
Scan mode: used to acquire the intensity image, depth map, and point cloud, and adjust the relevant parameters.
| Read Scanning Mechanism of Laser Profiler to familiarize yourself with the scanning mechanism of the laser profiler. |
Acquire Data
You can acquire data with the ![]() and
and ![]() buttons in the data acquisition area. The functions of these buttons differ in different data modes.
buttons in the data acquisition area. The functions of these buttons differ in different data modes.
Profile Mode
In the profile mode, click the above buttons to acquire the raw image and profile.
-
 : Click this button to acquire one raw image and one profile.
 -
 Click this button to start acquiring raw images and profiles continuously at the predetermined interval. After the acquisition has started, this button changes to
  . Click it again to stop the continuous acquisition.
Scan Mode
In the scan mode, the functions of the above buttons differ according to the Data Acquisition Trigger Source and Data Acquisition Method in use.
| Read Methods for Triggering Data Acquisition and Workflow of Triggering Data Acquisition to familiarize yourself with the different methods of triggering the laser profiler to acquire data. |
-
External:
or : Enter the laser profiler into the acquisition ready status. The laser profiler can only respond to externally input signals after it enters the acquisition ready status.The
button is not available when the data acquisition mode is Nonstop. -
Software:
Frame-Based Nonstop Enter the laser profiler into the acquisition ready status and trigger one round of data acquisition.
After the acquisition has started, this button changes to . Click it again to stop the current round of data acquisition.
Not available.
Enter the laser profiler into the acquisition ready status and trigger rounds of data acquisition continuously.
After the acquisition has started, this button changes to. Click it again to stop the continuous acquisition.Enter the laser profiler into the acquisition ready status and start continuously scanning the object while continuously returning fixed-length data segments.
After the acquisition has started, this button changes to. Click it again to stop the continuous acquisition.
Switch Data Type
The laser profiler outputs multiple types of data to Mech-Eye Viewer. Click the data type buttons to view the corresponding type of data.
Data Types in Profile Mode
In the profile mode, you can view the Raw Image and Profile types of data.
| Data type | Description | Example |
|---|---|---|
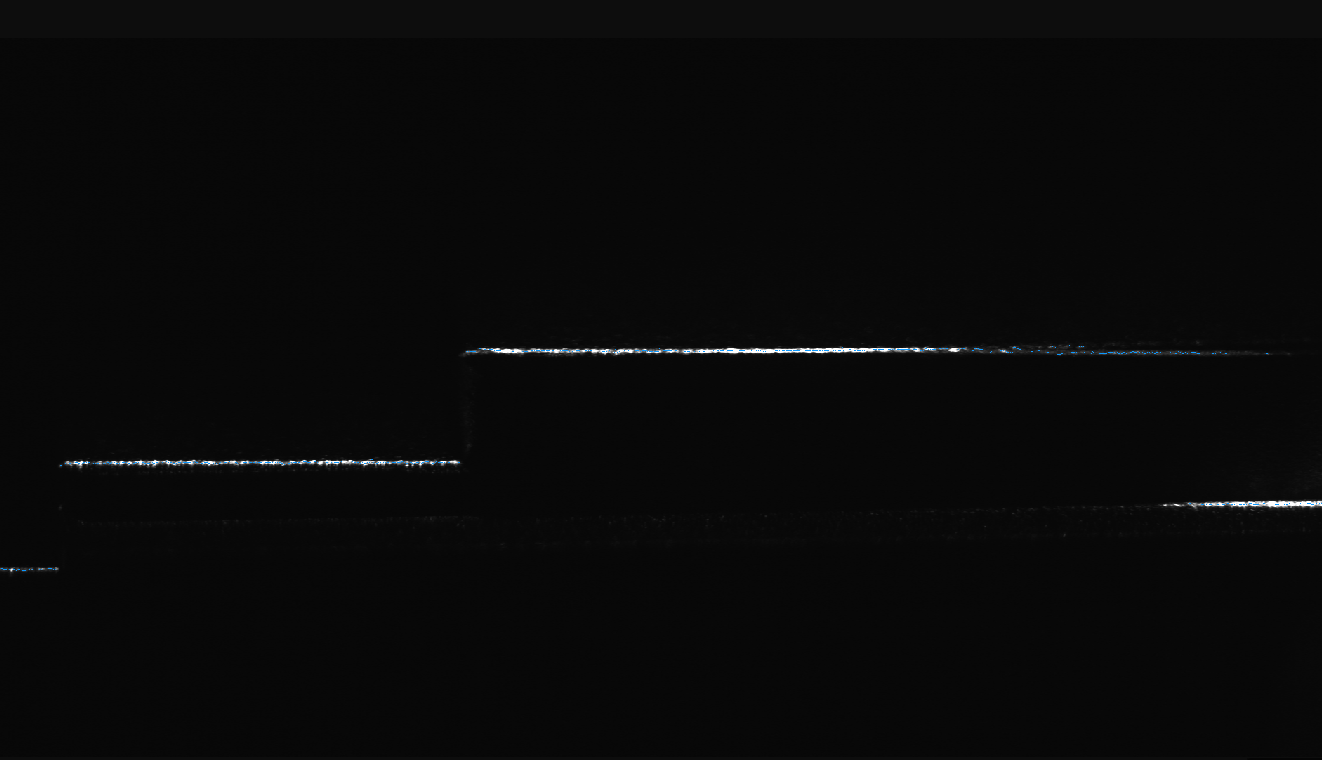
Raw image |
Used to check the brightness and location of the laser lines. |
|
Profile |
Used to check the profile extraction result, such as the amount of gaps in the profile. |
|
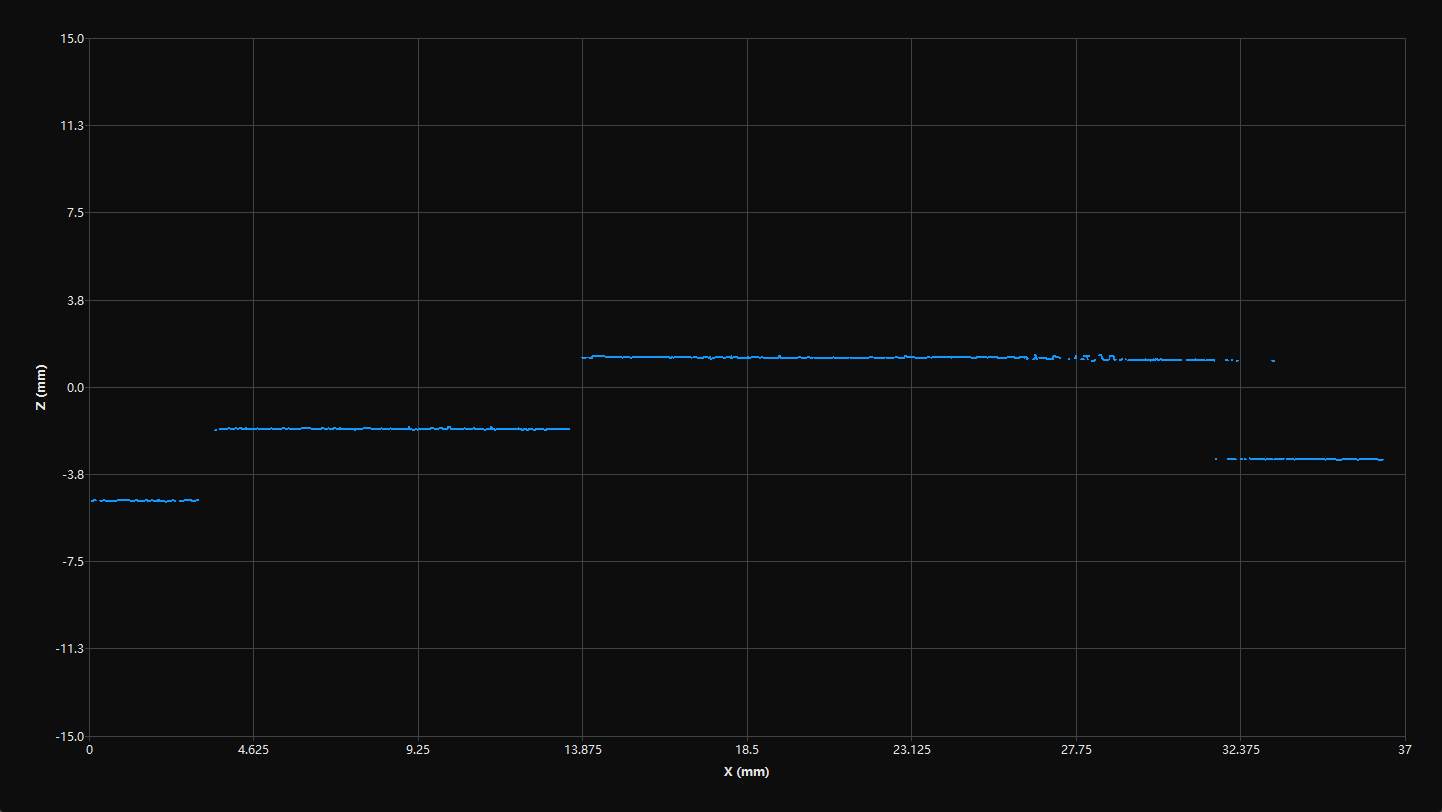
| On the profile, the depth value of the extraction spot in the column of pixels where the cursor is located is displayed. |
|
Explanation of the raw image
In a raw image:
For the process of extracting a profile, refer to Profile Extraction Process. 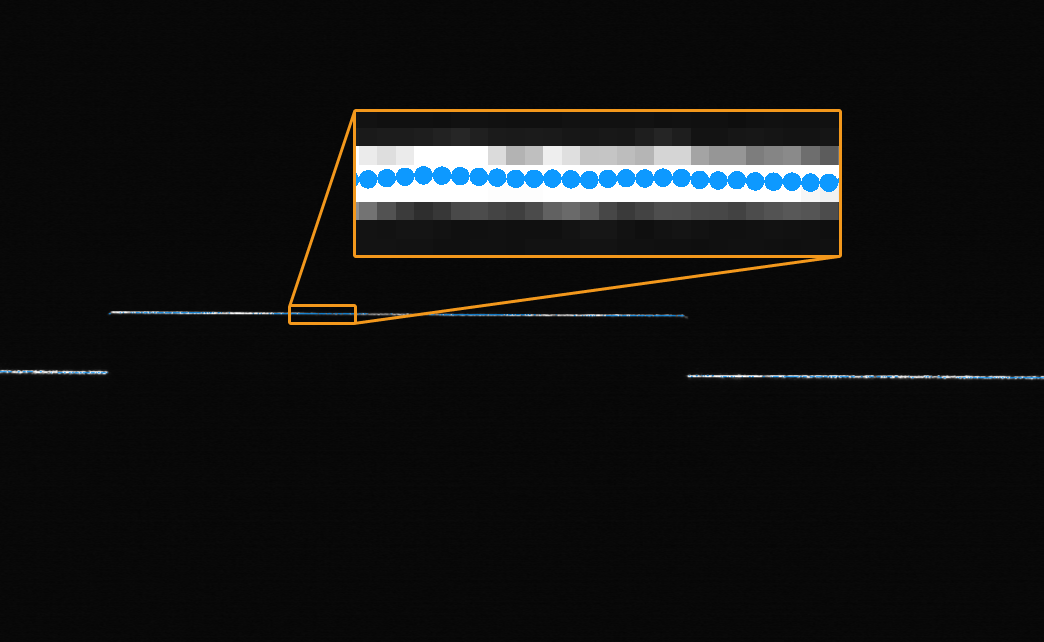
|
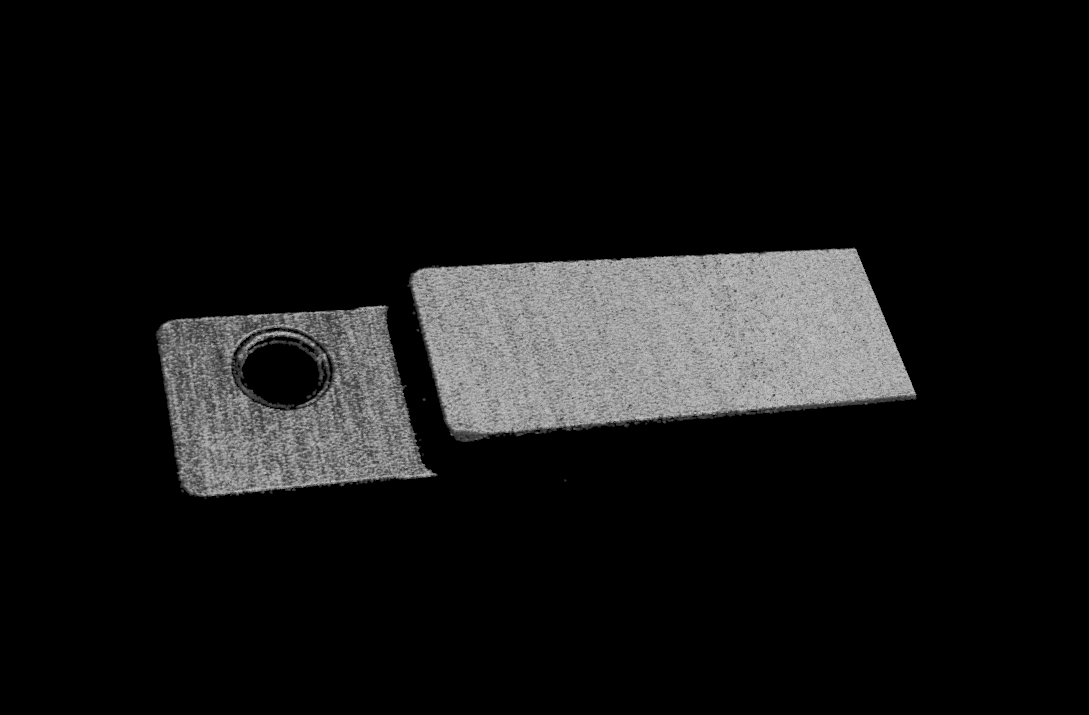
Data Types in Scan Mode
In the scan mode, you can view the Intensity Image, Depth Map, and Point Cloud types of data.
| Data type | Description | Example |
|---|---|---|
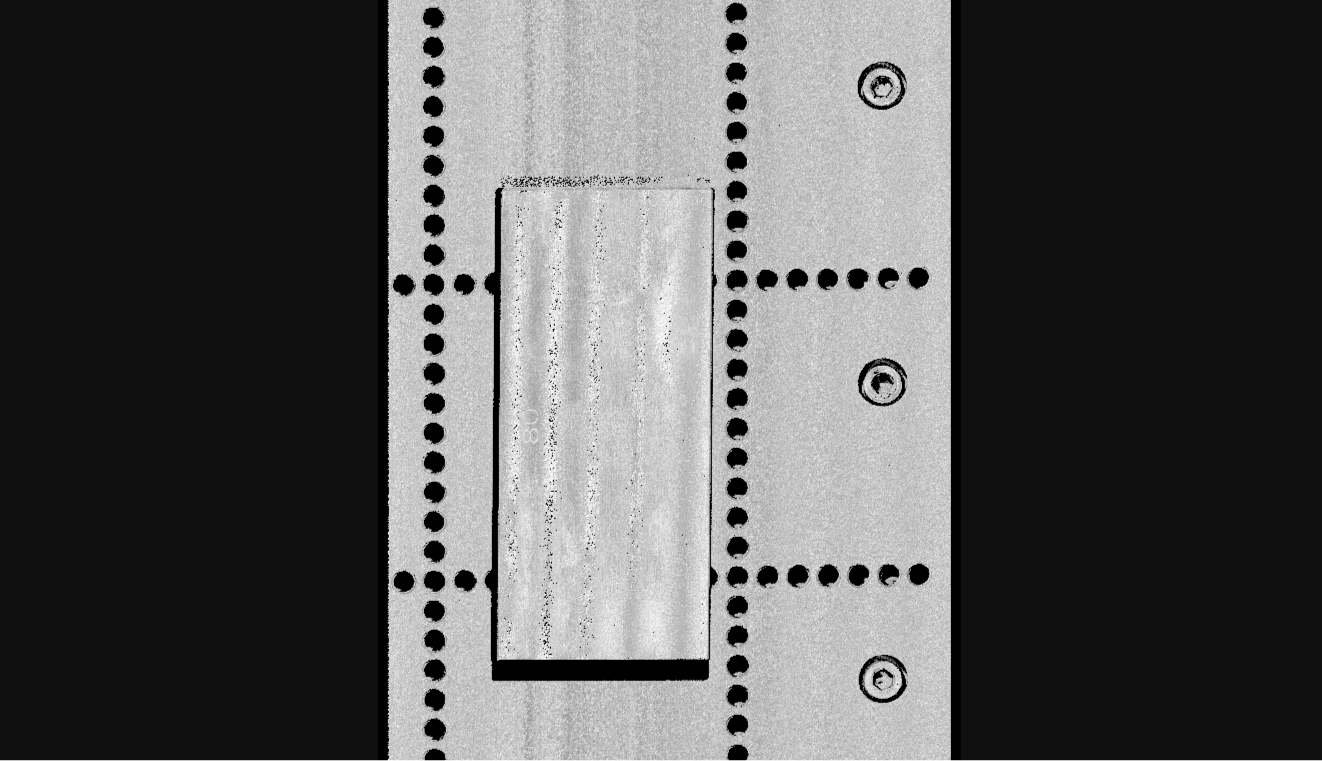
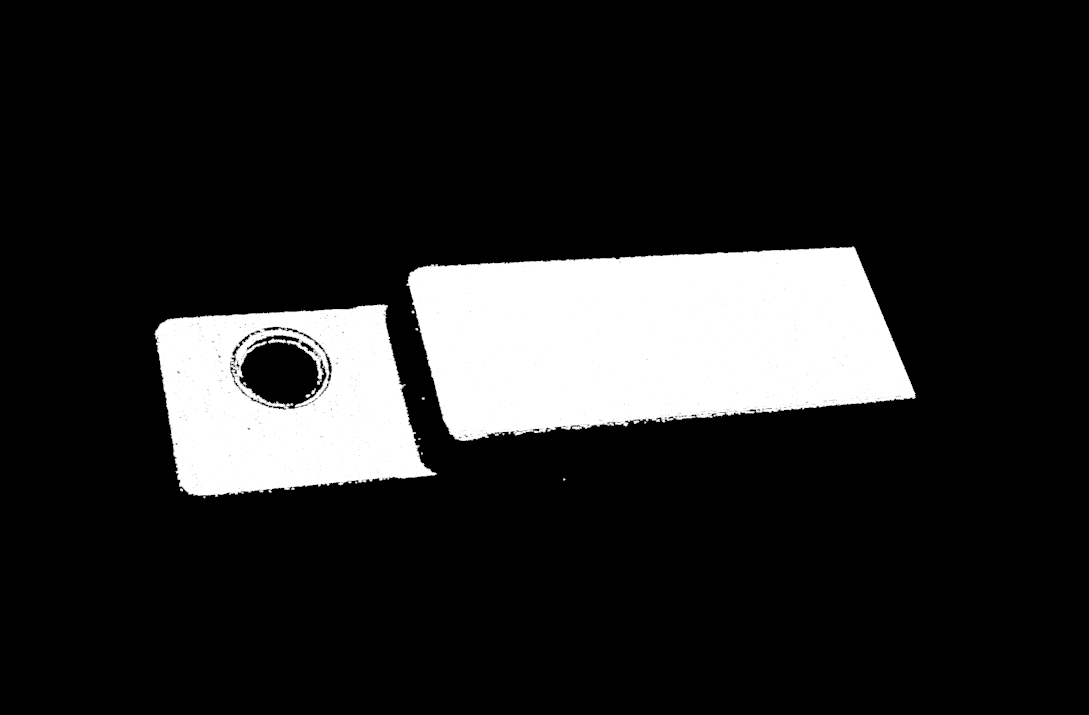
Intensity image |
A 2D image that represents the reflectivity of the object surface |
|
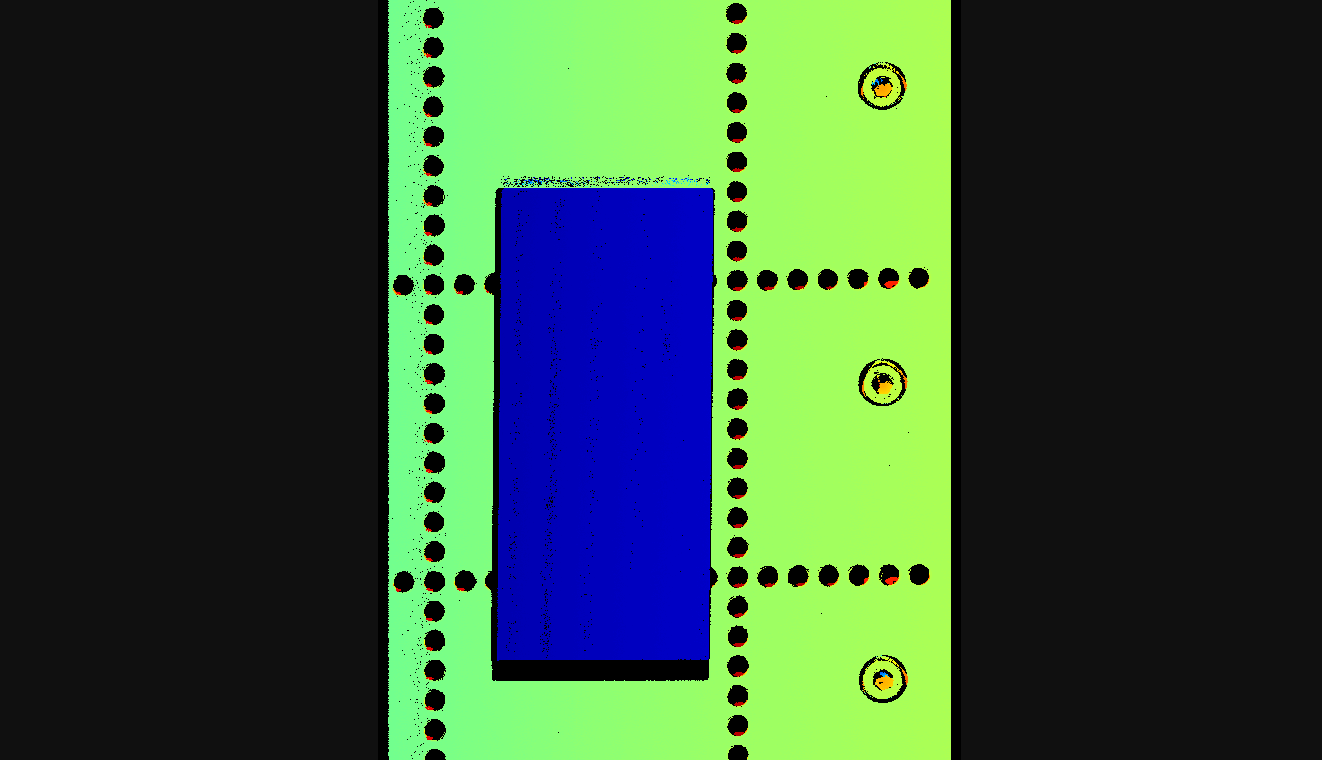
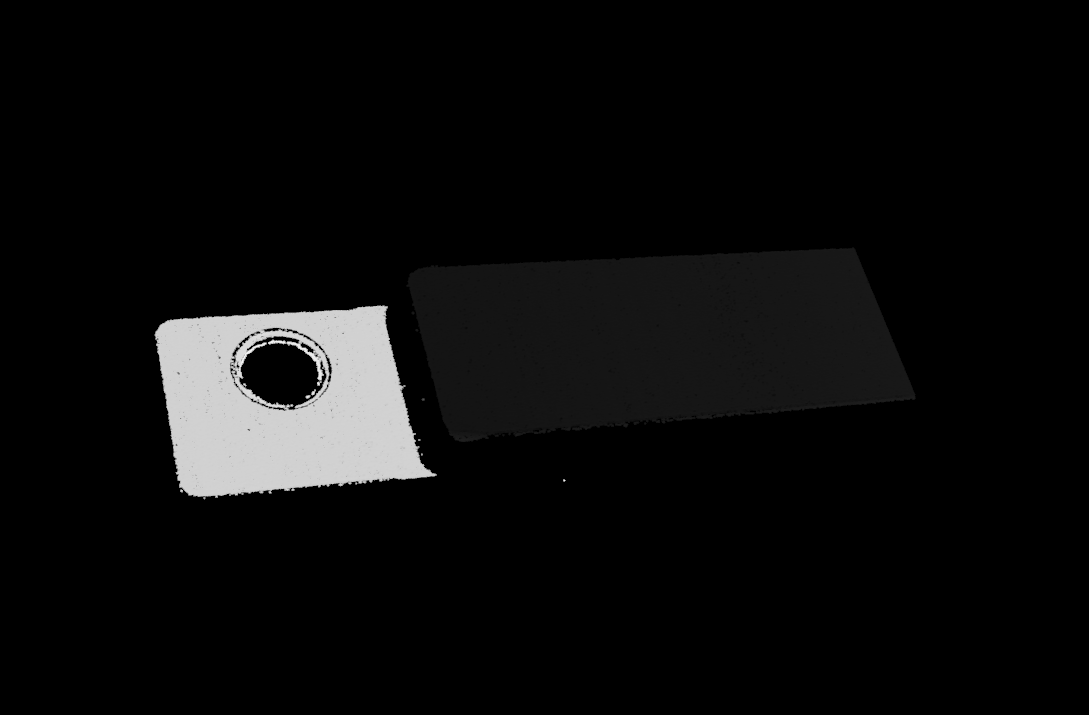
Depth map |
A 2D image that contains the depth information of the object surface |
|
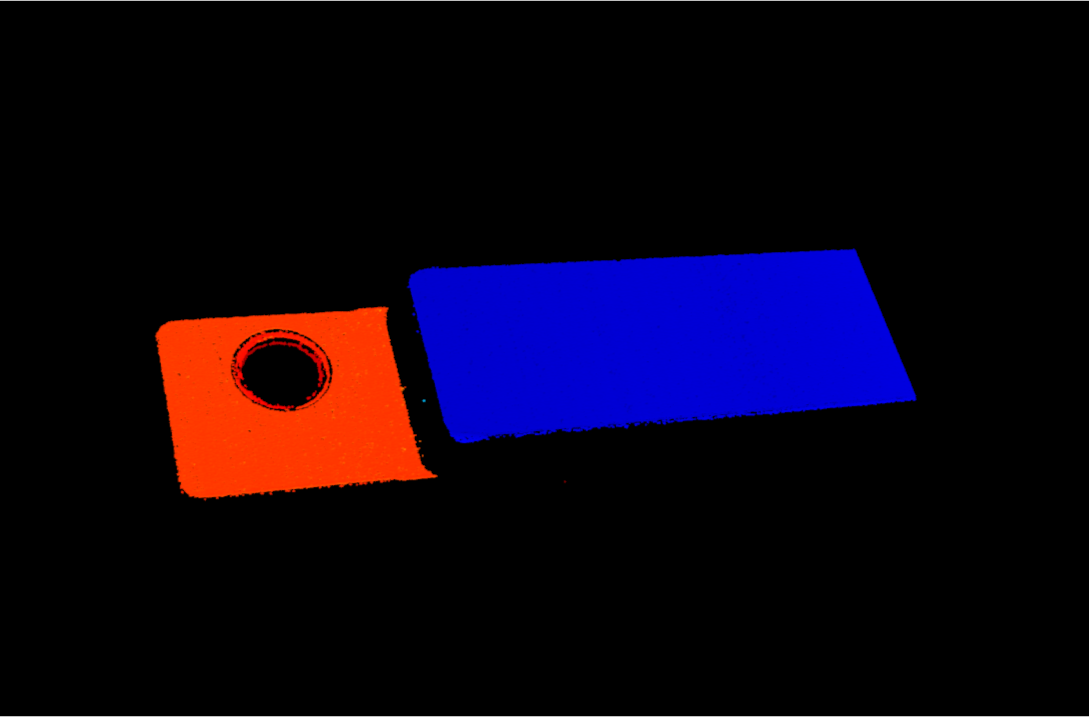
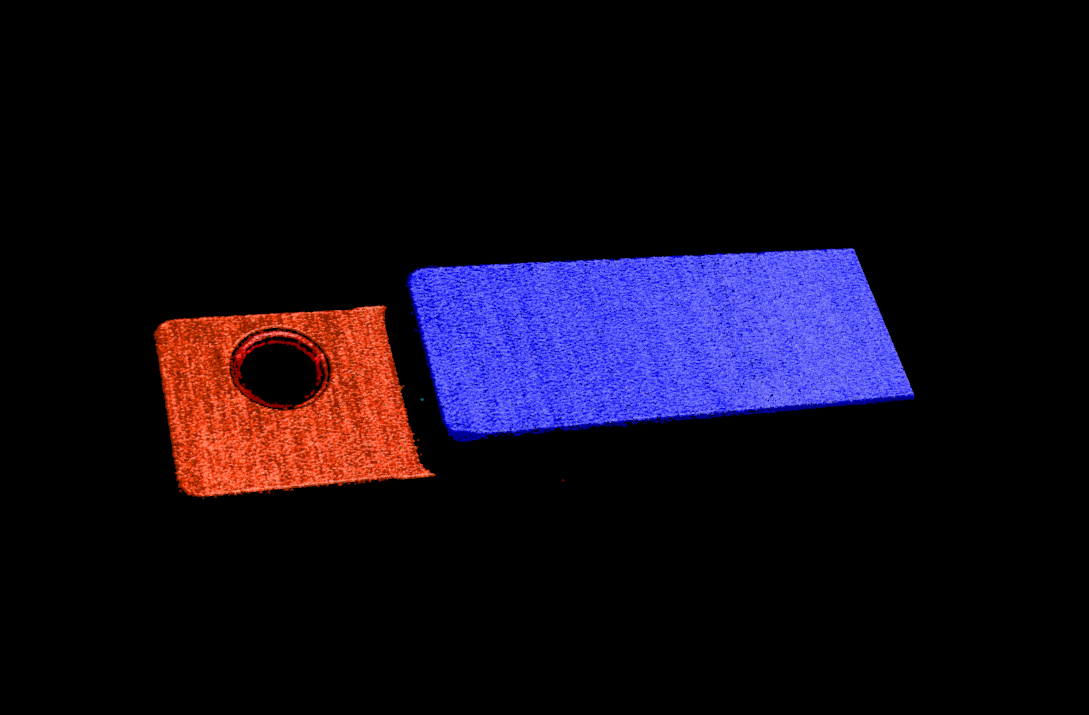
Point cloud |
A collection of data points that represent the 3D shape of the object surface |
|
Adjust Data Display
In the data display area, you can adjust the display of the data through mouse actions, keyboard, and buttons and menus in the software interface.
Adjust Raw Image Display
In the raw image display, you can perform the following actions:
-
Zoom: While the cursor is on the raw image, scroll the mouse wheel to zoom the raw image.
-
Move: While the raw image is zoomed in, hold and drag to move the raw image.
-
Reset size: Right-click the raw image and select Reset View to fit it to the window.
-
Check grayscale values: In the image information box at the lower right of the raw image, you can check the grayscale value of the pixel where the cursor is located.
To hide the image information box, uncheck Image Information Box in the View menu.
-
Display the exposure information: Display pixels with different grayscale values in different colors to help adjust parameters. For details, refer to Exposure Information, Intensity Curve, and Sharpness Curve.
-
Display the intensity and sharpness curves: Display the intensity and sharpness curves of the profile to help adjust parameters. For details, refer to Exposure Information, Intensity Curve, and Sharpness Curve.
When you zoom and move the raw image, the intensity and sharpness curves zoom and move together. You can also zoom and move the intensity and sharpness curves, and the raw image will zoom and move together.
Adjust Profile Display
In the profile display, you can perform the following actions:
-
Check the coordinates of extraction spots: While the cursor is in the profile reference frame grid, the coordinates of the extraction spot of the column of pixels where the cursor is located is displayed in real time.
-
Zoom: While the cursor is in the profile reference frame grid, scroll the mouse wheel to zoom the profile.
-
Move: While the profile is zoomed in, hold and drag to move the profile.
-
Reset size: Right-click the profile and select Reset View to fit it to the window.
Adjust Intensity Image Display
In the intensity image display, you can perform the following actions:
-
Zoom: While the cursor is on the intensity image, scroll the mouse wheel to zoom the intensity image.
-
Move: While the intensity image is zoomed in, hold and drag to move the intensity image.
-
Reset size: Right-click the intensity image and select Reset View to fit it to the window.
-
Check pixel position and intensity values: In the image information box at the lower right of the intensity image, you can check the pixel position and intensity values of the pixel where the cursor is located.
-
The pixel position of the upper-left corner of the image is (0, 0).
-
To hide the image information box, uncheck Image Information Box in the View menu.
-
Adjust Depth Map Display
In the depth map display, you can perform the following actions:
-
Zoom: While the cursor is on the depth map, scroll the mouse wheel to zoom the depth map.
-
Move: While the depth map is zoomed in, hold and drag to move the depth map.
-
Reset size: Right-click the depth map and select Reset View to fit it to the window.
-
Check pixel position and coordinates: In the image information box at the lower right of the depth map, you can check the pixel position and coordinates (in mm) in the laser profiler reference frame of the pixel where the cursor is located.
-
The pixel position of the upper-left corner of the image is (0, 0).
-
To hide the image information box, uncheck Image Information Box in the View menu.
-
-
Adjust depth data display: The display of the depth data can be adjusted in the left panel. For detailed instructions, please refer to Adjust Depth Data Display.
Adjust Point Cloud Display
In the point cloud display, you can perform the following actions:
-
Zoom: Scroll the mouse wheel to zoom the point cloud.
-
Rotate: Hold the left mouse button and drag to rotate the point cloud.
-
Pan: Hold the mouse wheel and drag to pan the point cloud.
-
Adjust depth data display: The display of the depth data can be adjusted in the left panel. For detailed instructions, please refer to Adjust Depth Data Display.
-
In the upper-right corner of the display area, click the
 icon to enable/disable the measurement feature. After the measurement feature is enabled, the following icons are displayed on the interface:
Icon Functionalities 
Click this icon, press Shift, and click the left mouse button to select two points on the point cloud to measure the straight-line distance between them.

Click this icon, press Shift, and click the left mouse button to select three points on the point cloud to measure the angle between two edges.

Click this icon, press Shift, and click the left mouse button to select any three points on a circle on the point cloud to calculate its diameter.

Click this icon to display all measurement results on the point cloud. When this feature is disabled, only the most recent measurement result is displayed on the point cloud.
-
Use the icons on the right side of the data display area to adjust the display of the point cloud and reference frame:
Icon Functionalities 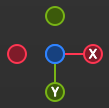
Hold and drag the icon to rotate the view. Click one of the circles to rotate the view so that the coordinate axis on the custom reference frame represented by the circle points forward.
For example, click the -X circle to rotate the view so that the negative direction of the X-axis of the custom reference frame points forward.
Hold and drag the icon to pan the view.

Hold and drag the icon to zoom the point cloud.

Click the icon to adjust the point cloud and reference frame to fit the window size.

Click the icon to switch between the perspective and orthographic view for the point cloud.

After clicking the icon, the window prompts the key or mouse button that you press. Click the icon again to stop the prompts.

Click the icon to display the reference frame grid. Click the icon again to hide the grid.

Click this icon to display the point cloud ROI. Click it again to exit the ROI mode. For detailed instructions, please refer to Adjust Point Cloud ROI.
Adjust Point Cloud ROI
In the point cloud ROI, you can use the mouse to adjust the ROI in the following methods:
-
Hold the Ctrl key and drag with the mouse to move or resize the point cloud ROI.
-
Hold both Ctrl and Space to rotate the ROI using the mouse.
In the Point Cloud ROI menu at the lower-left corner of the interface, you can also adjust the ROI’s position, size, and orientation by setting the following parameters:
-
X-Axis Center Position: sets the X-axis coordinate of the center of the point cloud ROI box.
-
Y-Axis Center Position: sets the Y-axis coordinate of the center of the point cloud ROI box.
-
Z-Axis Center Position: sets the Z-axis coordinate of the center of the point cloud ROI box.
-
Length: sets the length of the point cloud ROI box.
-
Width: sets the width of the point cloud ROI box.
-
Height: sets the height of the point cloud ROI box.
-
X-Axis Rotation Angle: sets the rotation angle of the point cloud ROI box around the X-axis.
-
Y-Axis Rotation Angle: sets the rotation angle of the point cloud ROI box around the Y-axis.
-
Z-Axis Rotation Angle: sets the rotation angle of the point cloud ROI box around the Z-axis.
|
Adjust Depth Data Display
In the left panel of the depth map or point cloud display, you can adjust the display reference frame, color rendering, and range of the depth data.
Change Reference Frame
In the Reference Frame menu at the top of the left panel, you can select the reference frame used for displaying the depth data.
-
Device (default): displays the depth data in the laser profiler reference frame.
-
Custom: displays the depth data in the custom reference frame defined by the user.
| The reference frame setting is simultaneously applied to both depth map and point cloud. |
Change Color Rendering
In the Color menu in the left panel, you can choose the color rendering scheme of the depth map and the point cloud.
The Jet, Grayscale, and Jet + intensity options are available for both the depth map and point cloud. When one of these three options is selected, the depth range of the color rendering can be adjusted.
| Option | Description | Example |
|---|---|---|
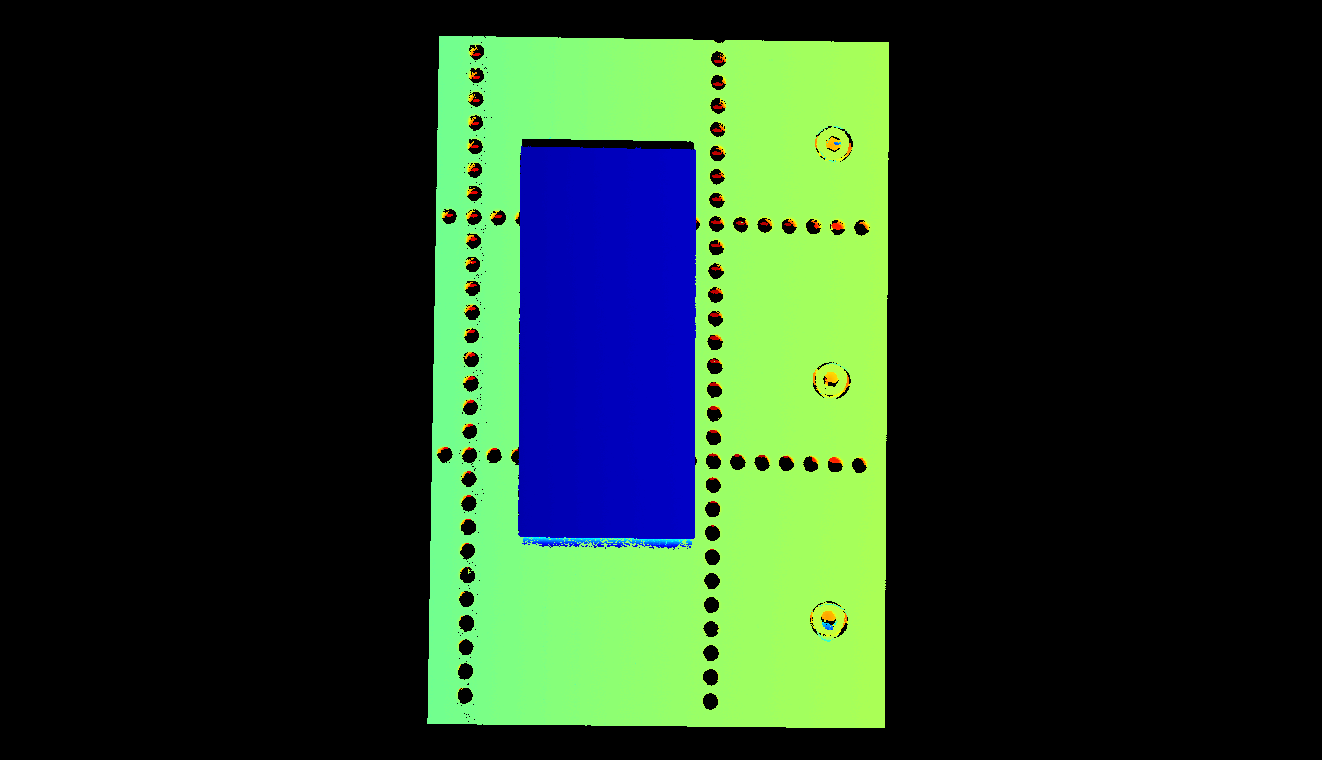
Jet |
Depth values are displayed in different colors of the jet color scheme. |
|
Grayscale |
Depth values are displayed in different shades of gray. |
|
Jet + intensity |
The intensity information of the object surface is overlaid on the jet color scheme. Suitable for checking the object surface features and depth changes at the same time. |
|
The Untextured and Textured options are only available for the point cloud.
| Option | Description | Example |
|---|---|---|
Untextured |
Displays the untextured, white point cloud. |
|
Textured |
Display the point cloud textured with the intensity image. |
|
| When Untextured or Textured is selected, if you switch to the depth map display and then switch back to the point cloud display, the Color setting will be automatically changed to the option selected in the depth map display. |
Adjust Point Size
You can adjust the point size of the point cloud by setting the Point Size parameter on the left side of the interface.
Adjust Depth Range of Color Rendering
When the depth map and point cloud are displayed in Jet ,Grayscale or Jet + intensity, every time data acquisition is performed, Mech-Eye Viewer automatically adjusts the color rendering according to the range of the obtained depth data.
With the functions in the Range section of the left panel, you can adjust the depth range in which the color is rendered, in order to conveniently observe the depth variation in a specific range.
| The depth range of color rendering is simultaneously applied to both depth map and point cloud. |
Follow these steps to adjust the color rendering range of the depth data:
-
Adjust the range of depth data to be displayed: adjust the Min and Max values at the two ends of the slider. Depth data outside this range is not displayed.
-
Check the rough depth: On the depth map, move the cursor to the area to be observed, and check the third value of Coordinates in the image information box in the lower right. This is the depth value.
-
Adjust depth range of color rendering: Move the slider handles or enter the depth values on the right of the slider to adjust the depth range of color rendering according to your needs.
After adjusting the range, the depth values outside this range are displayed in the colors corresponding to the minimum/maximum depth values.
-
Lock the range: If you need to compare the depth variations in the same range across multiple acquisitions, you can click the Lock icon
 above the slider. When you acquire data again, the depth range of color rendering manually adjusted will be used.
To change back to the automatically adjusted range, click the lock icon
 again and then click the reset icon
  to the left.
View Virtual Device Files
To open a virtual device, click in the menu bar.
You can perform the following operations on a virtual device:
-
Switch the data mode.
-
Change the visibility of parameters.
-
Scan Mode:
-
Click the
button in the data acquisition area to view the acquired data. -
Save the acquired intensity image, depth map, and point cloud to local.
When the virtual device is in Profile Mode, you can only view the parameters settings and cannot acquire data.
-
-
Adjust the Point Cloud Y-Axis Resolution parameter.
This topic introduced data acquisition and data types. The next topic will introduce actions related to parameters.