Scan Mode
This topic provides descriptions of the parameters in the scan mode.
Trigger Settings
Select the trigger sources and set relevant parameters.
| For the methods of triggering the laser profiler to acquire data in the scan mode, please refer to Methods for Triggering Data Acquisition and Workflow of Triggering Data Acquisition. |
Data Acquisition Trigger Source
Description |
Select the source of the signals that trigger data acquisition. In one round of data acquisition, multiple lines are scanned, multiple profiles are generated, and one intensity image and one depth map are generated using the profile data. |
||
|---|---|---|---|
Visibility |
Beginner, Expert, Guru |
||
Values |
|
||
Instruction |
If you use externally input signals to trigger data acquisition, select External. Otherwise, select Software.
|
Line Scan Trigger Source
Description |
Select the source of the signals that trigger the scan of a single line. |
||
|---|---|---|---|
Visibility |
Beginner, Expert, Guru |
||
Values |
|
||
Instruction |
After selecting different options, different parameters are displayed in the Trigger Settings category for adjustment:
|
| Please set Data Acquisition Trigger Source and Line Scan Trigger Source based on the combination of triggering methods in use. |
Encoder: Trigger Direction
Description |
Select the encoder motion direction that triggers scanning. |
|---|---|
Visibility |
Beginner, Expert, Guru |
Values |
|
Instruction |
Adjust this parameter based on the output signals of the encoder and the motion direction of the target object relative to the laser profiler. |
Encoder: Trigger Signal Counting Mode
Description |
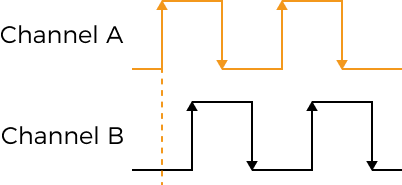
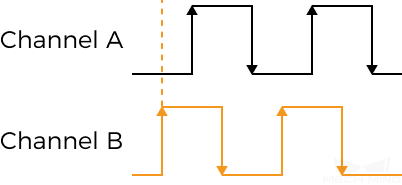
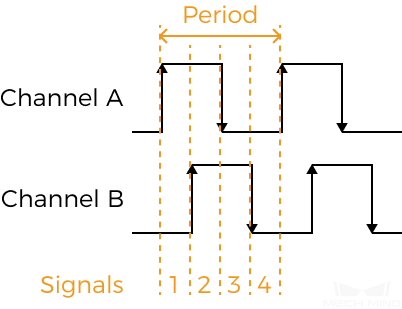
Set the number of quadrature signals to be counted in an encoder period. Counted signals are used to trigger scanning (These signals are trigger signals). Each encoder period contains 4 quadrature signals, as shown below.
|
||
|---|---|---|---|
Visibility |
Beginner, Expert, Guru |
||
Values |
|
||
Instruction |
|
Encoder: Trigger Interval
Description |
Set the number of trigger signals needed for scanning one line. |
||
|---|---|---|---|
Visibility |
Beginner, Expert, Guru |
||
Values |
|
||
Instruction |
|
Use Trigger Interval Calculator
Using Trigger Interval Calculator, you can calculate the value of Trigger Interval that makes the Y-axis resolution of the scan data equal to the X-axis resolution, thus obtaining the intensity image and depth map with the aspect ratio that matches the actual object.
Follow these steps to use Trigger Interval Calculator to calculate the value of Trigger Interval:
-
Double-click Calculate to the right of Trigger Interval to open Trigger Interval Calculator.
-
Enter the value of Encoder resolution: The encoder resolution is the travel distance (in μm) of the target object relative to the laser profiler during the duration of each signal in the following figure.
-
Click Apply to close the current window. In the scan mode, acquire data again and check the aspect ratio of the intensity image and depth map.
-
If the aspect ratio matches the actual object, the process is completed.
-
If the aspect ratio does not match the actual object, proceed to the next step.
-
-
Check the set value of Trigger Signal Counting Mode:
-
If it is 1× or 2×, proceed to step 5.
-
If it is 4×, proceed to step 8.
-
-
Double-click Calculate to the right of Trigger Interval to open Trigger Interval Calculator.
-
Increase the value of Trigger Signal Counting Mode.
-
Click Apply to close the current window. In the scan mode, acquire data again and check the aspect ratio of the intensity image and depth map.
-
If the aspect ratio matches the actual object, the process is completed.
-
If the aspect ratio does not match the actual object, repeat step 4.
-
-
Based on the aspect ratio of the intensity image and depth map, finetune Current Value under Trigger Interval:
-
If the images appear compressed relative to the actual object, increase Current Value by 1.
-
If the images appear stretched relative to the actual object, decrease Current Value by 1.
-
-
In the scan mode, acquire data again and check the aspect ratio of the intensity image and depth map.
-
If the aspect ratio matches the actual object, the process is completed.
-
If the aspect ratio does not match the actual object, repeat step 8.
-
Fixed-Rate: Trigger Rate
Description |
When Line Scan Trigger Source is set to Fixed rate, set the fixed rate at which the laser profiler is triggered to scan. |
||
|---|---|---|---|
Visibility |
Beginner, Expert, Guru |
||
Values |
|
||
Instruction |
|
Scan Settings
Set other parameters that affect the scanning process.
Scan Line Count
Description |
Set the number of profiles needed to generate one intensity image/depth map. |
||
|---|---|---|---|
Visibility |
Beginner, Expert, Guru |
||
Values |
|
||
Instruction |
Make sure that the set value can cover one target object completely. You can refer to the following equation to calculate the appropriate parameter value: Scan Line Count = length of target object (μm) ÷ Y-axis resolution of scan data (μm)
|
Timeout Period
Description |
Set the timeout period for data acquisition. After data acquisition is triggered, if the software does not receive data within the set timeout period, the current round of data acquisition is automatically stopped. |
|---|---|
Visibility |
Beginner, Expert, Guru |
Values |
|
Instruction |
Adjust based on the actual needs. |
Exposure Delay
Description |
Set the delay time between laser emission and start of exposure. Larger exposure delay results in more stable brightness of the laser lines in the raw image, thus more stable quality of the intensity image and depth map. However, the max scan rate will be reduced. |
|---|---|
Visibility |
Guru |
Values |
|
Instruction |
If the quality of the obtained data is unstable (such as the depth fluctuation of the same position on the same object is large), you can increase the value of this parameter. |
Point Cloud Resolutions
Check the X-axis resolution and set the Y-axis resolution of the point cloud.
X-Axis Resolution
Description |
Displays the resolution in the X direction, which is the distance between two neighboring points along the direction of the laser line.
|
||
|---|---|---|---|
Visibility |
Beginner, Expert, Guru |
||
Values |
|
Y-Axis Resolution
Description |
Set the resolution in the Y direction, which is the distance between two neighboring points along the travel direction of the target object. |
|---|---|
Visibility |
Beginner, Expert, Guru |
Values |
|
Instruction |
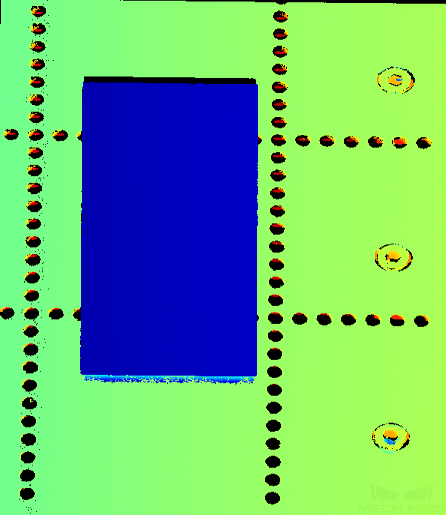
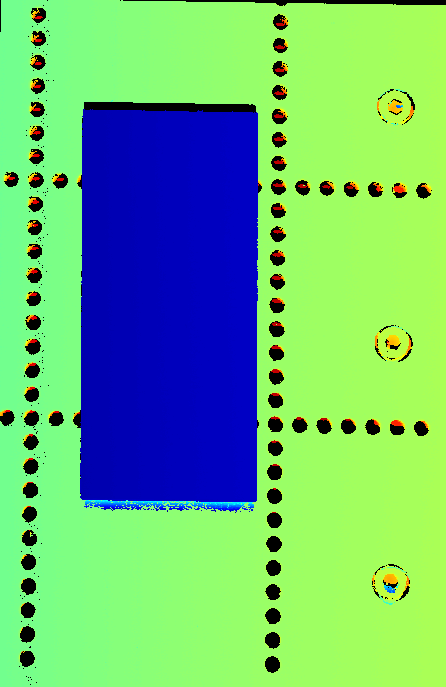
This parameter only affects the Y-axis resolution of the point cloud. If in the point cloud, the distance between two points neighboring along the Y-axis is shorter than the actual distance, please increase the value of this parameter. Otherwise, decrease the value of this parameter. |
Point clouds obtained with different Y-Axis Resolution values (all other conditions identical):
| Y-Axis Resolution: 12 μm | Y-Axis Resolution: 23.5 μm | Y-Axis Resolution: 35 μm |
|---|---|---|
|
|
|
Mask
Description |
Use masks to exclude unneeded data, such as noise and laser lines produced by interreflection. |
|---|---|
Visibility |
Beginner, Expert, Guru |
Values |
Enable Mask:
|
Instruction |
Double-click Edit to open the Mask Tool window. For detailed instructions, refer to Use Mask Tool below. |
Use Mask Tool
Through the mask tool, you can add, edit, and delete masks.
Add Masks
Follow these steps to add masks:
-
Select the appropriate tool in the toolbar on the left:
-
 : used to add a rectangle mask.
 -
 : used to add a polygon mask.
-
-
Determine the location of the unneeded data in the raw image and draw a mask:
-
Rectangle mask: Hold and drag.
-
Polygon mask: Click to add a vertex of the polygon mask. After all needed vertices are added, press the Enter key or right-click to finish drawing the polygon mask.
In a polygon mask, the overlapped regions are not effective:

-
Click Acquire again at the top to acquire the raw image after the masks are added to check the effect of the masks.
-
If the position, shape, or size of the masks are not satisfactory, you can edit the masks or delete the masks.
-
-
-
After all masks are added, click Apply to close the current window.
After Apply is clicked, the value of the Enable Mask parameter is automatically changed to True. If you do not need to apply the masks, change the value of this parameter to False.
Edit Masks
If the position, shape, or size of the masks are not satisfactory, follow these steps to edit the masks:
-
Click
 in the toolbar on the left.
 -
Select the mask that needs to be edited and conduct the needed adjustment:
-
Move a mask: Select the mask and drag.
-
Adjust the size of a rectangle mask: Select a vertex of the rectangle mask and drag.
-
Adjust the shape of a polygon mask:
-
Move an existing vertex: Select a vertex of the polygon mask and drag.
-
Add a new vertex: Left-click on an edge of the polygon mask.
-
Delete an existing vertex: Select a vertex of the polygon mask and right-click.
Click Acquire again at the top to acquire the raw image after the masks are edited to check the effect of the masks.
-
-
-
After all editing is completed, click Apply to close the current window.
After Apply is clicked, the value of the Enable Mask parameter is automatically changed to True. If you do not need to apply the masks, change the value of this parameter to False.
Delete Masks
Follow these steps to delete unsatisfactory masks:
-
In the right panel, select the mask that needs to be deleted in Mask list, and click
 .
.If you need to delete all the masks, click Clear to the right of Mask list. -
In the pop-up window, click Confirm to delete the mask.
Click Acquire again at the top to acquire the raw image after the mask is deleted to check the effect of the remaining masks. -
After all deletion is completed, click Apply to close the current window.
After Apply is clicked, the value of the Enable Mask parameter is automatically changed to True. If you do not need to apply the masks, change the value of this parameter to False.
Correction
The parameters in this category are used to correct the tilt of and height error in the profile.
Tilt Correction
Description |
Correct the tilt of the profile, which is caused by the rotation of the laser profiler around the Y-axis. |
|---|---|
Visibility |
Beginner, Expert, Guru |
Values |
Enable Tilt Correction:
Tilt Correction Angle:
|
Instruction |
For detailed instructions, refer to Perform Tilt Correction below. |
Perform Tilt Correction
This tool is used to correct the tilt of the profile, which is caused by the rotation of the laser profiler around the Y-axis.
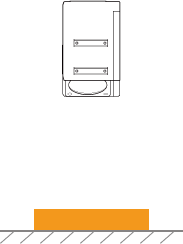
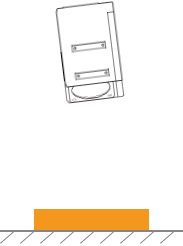
As shown below, the rotation of the laser profiler around the Y-axis make the tilt of the acquired profile differ from the tilt of the actual object.
Not rotated |
Rotated around the Y-axis |
||
Laser profiler |
|
|
|
Acquired profile |
|
|
|
Prerequisites
In order to perform tilt correction, the following prerequisites must be satisfied:
-
It is recommended to use a target object whose surface includes flat regions.
-
A relatively complete profile of the flat regions can be acquired. If the profile is incomplete, please refer to Profile Mode and adjust the other parameters first.
-
Keep the target object still relative to the laser profiler, and acquire the profile of the flat regions on the target object.
Instructions
Follow these steps to perform tilt correction:
-
Double-click Edit to the right of Tilt Correction to open the Tilt Correction window.
-
Select the detection areas and drag to adjust their positions. Make sure to satisfy the following criterion while adjusting:
The profile selected by the two detection areas should correspond to two locations on the same flat region of the target object. Please refer to the following example:
Target object 
Detection areas
Correct
Incorrect
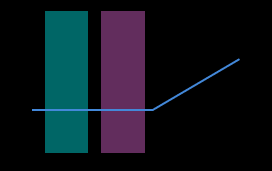
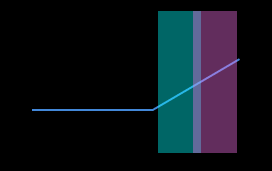
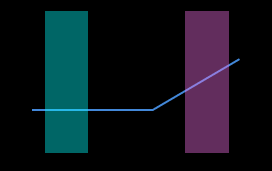
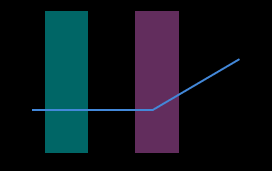
The detection areas can overlap. -
Select the detection areas and drag the handles on them to adjust their widths. Refer to the following criterion while adjusting:
With the above criterion satisfied, the detection area can be as wide as possible to include more data for tilt correction.
-
In Expected tilt angle under Tilt angles, enter the angle that the profile in the detection areas should reach after the correction.
Positive values rotate the profile counterclockwise; negative values rotate the profile clockwise. The range of possible values is -45° to 45°. Example of expected tilt angle
A target object as shown below is placed on a horizontal surface:
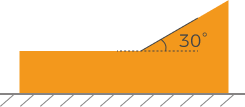
The value that should be entered for Expected tilt angle depends on the positions of the detection areas:
Detection areas Expected tilt angle 
0°

30°
-
Click Correct. The green line in the image area on the left represents the profile that has been rotated to Expected tilt angle after tilt correction. Check if this profile satisfies your requirements:
-
If yes, click Apply to apply the tilt correction result and close the window.
-
If no, repeat steps 2 to 5.
-
-
Acquire data again in the profile mode and switch to Profile to check the effect of correction.
Height Correction
Description |
Correct the height error in the profile, which is caused by the rotation of the laser profiler around the X-axis. |
|---|---|
Visibility |
Beginner, Expert, Guru |
Values |
Enable Height Correction:
Height Correction Ratio:
|
Instruction |
For detailed instructions, refer to Perform Height Correction below. |
Perform Height Correction
This tool is used to correct the height error in the profile, which is caused by the rotation of the laser profiler around the X-axis.
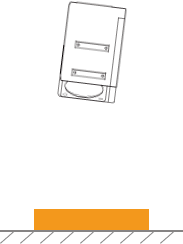
As shown below, the rotation of the laser profiler around the X-axis make the height difference between two locations in the acquired profile differ from the actual difference.
| Not rotated | Rotated around the X-axis | |
|---|---|---|
Laser profiler |
|
|
Acquired profile |
|
|
Prerequisites
In order to perform height correction, the following prerequisites must be satisfied:
-
It is recommended to use a target object with known dimensions and flat surfaces, such as a gauge block, and place the target object on a horizontal surface.
-
A relatively complete profile of the target object can be acquired. If the profile is incomplete, please refer to Profile Mode and adjust the other parameters first.
-
Keep the target object still relative to the laser profiler.
-
Select two surfaces (such as the top surface of the gauge block and the horizontal surface on which the gauge block is placed) for calculating the height difference, and determine the actual height difference of the two surfaces.
Instructions
Follow these steps to perform height correction:
-
Double-click Edit to the right of Height Correction to open the Height Correction window.
-
Select the detection areas and drag to adjust their positions. Make sure to satisfy the following criterion while adjusting:
The profile segments selected by the two detection areas should correspond respectively two the two surfaces used for calculating the height difference.
Two surfaces used for calculating the height difference

Detection areas
Correct
Incorrect
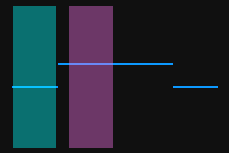
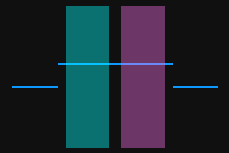
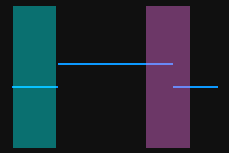
-
Select the detection areas and drag the handles on them to adjust their widths. Refer to the following criterion while adjusting:
With the above criterion satisfied, the detection areas can be as wide as possible to include more data for height correction.
-
In Actual height difference under Height differences, enter the actual height difference between the two surfaces.
The minimum value of Actual height difference is 0.01 mm, and the maximum value is the Z-axis measurement range of the laser profiler. -
Click Correct. The green line in the image area on the left represents the profile after height correction. Check if this profile satisfies your requirements:
-
If yes, click Apply to apply the height correction result and close the window.
-
If no, repeat steps 2 to 5.
-
-
Acquire data again in the profile mode and switch to Profile to check the effect of correction.
