Acquire and View Data
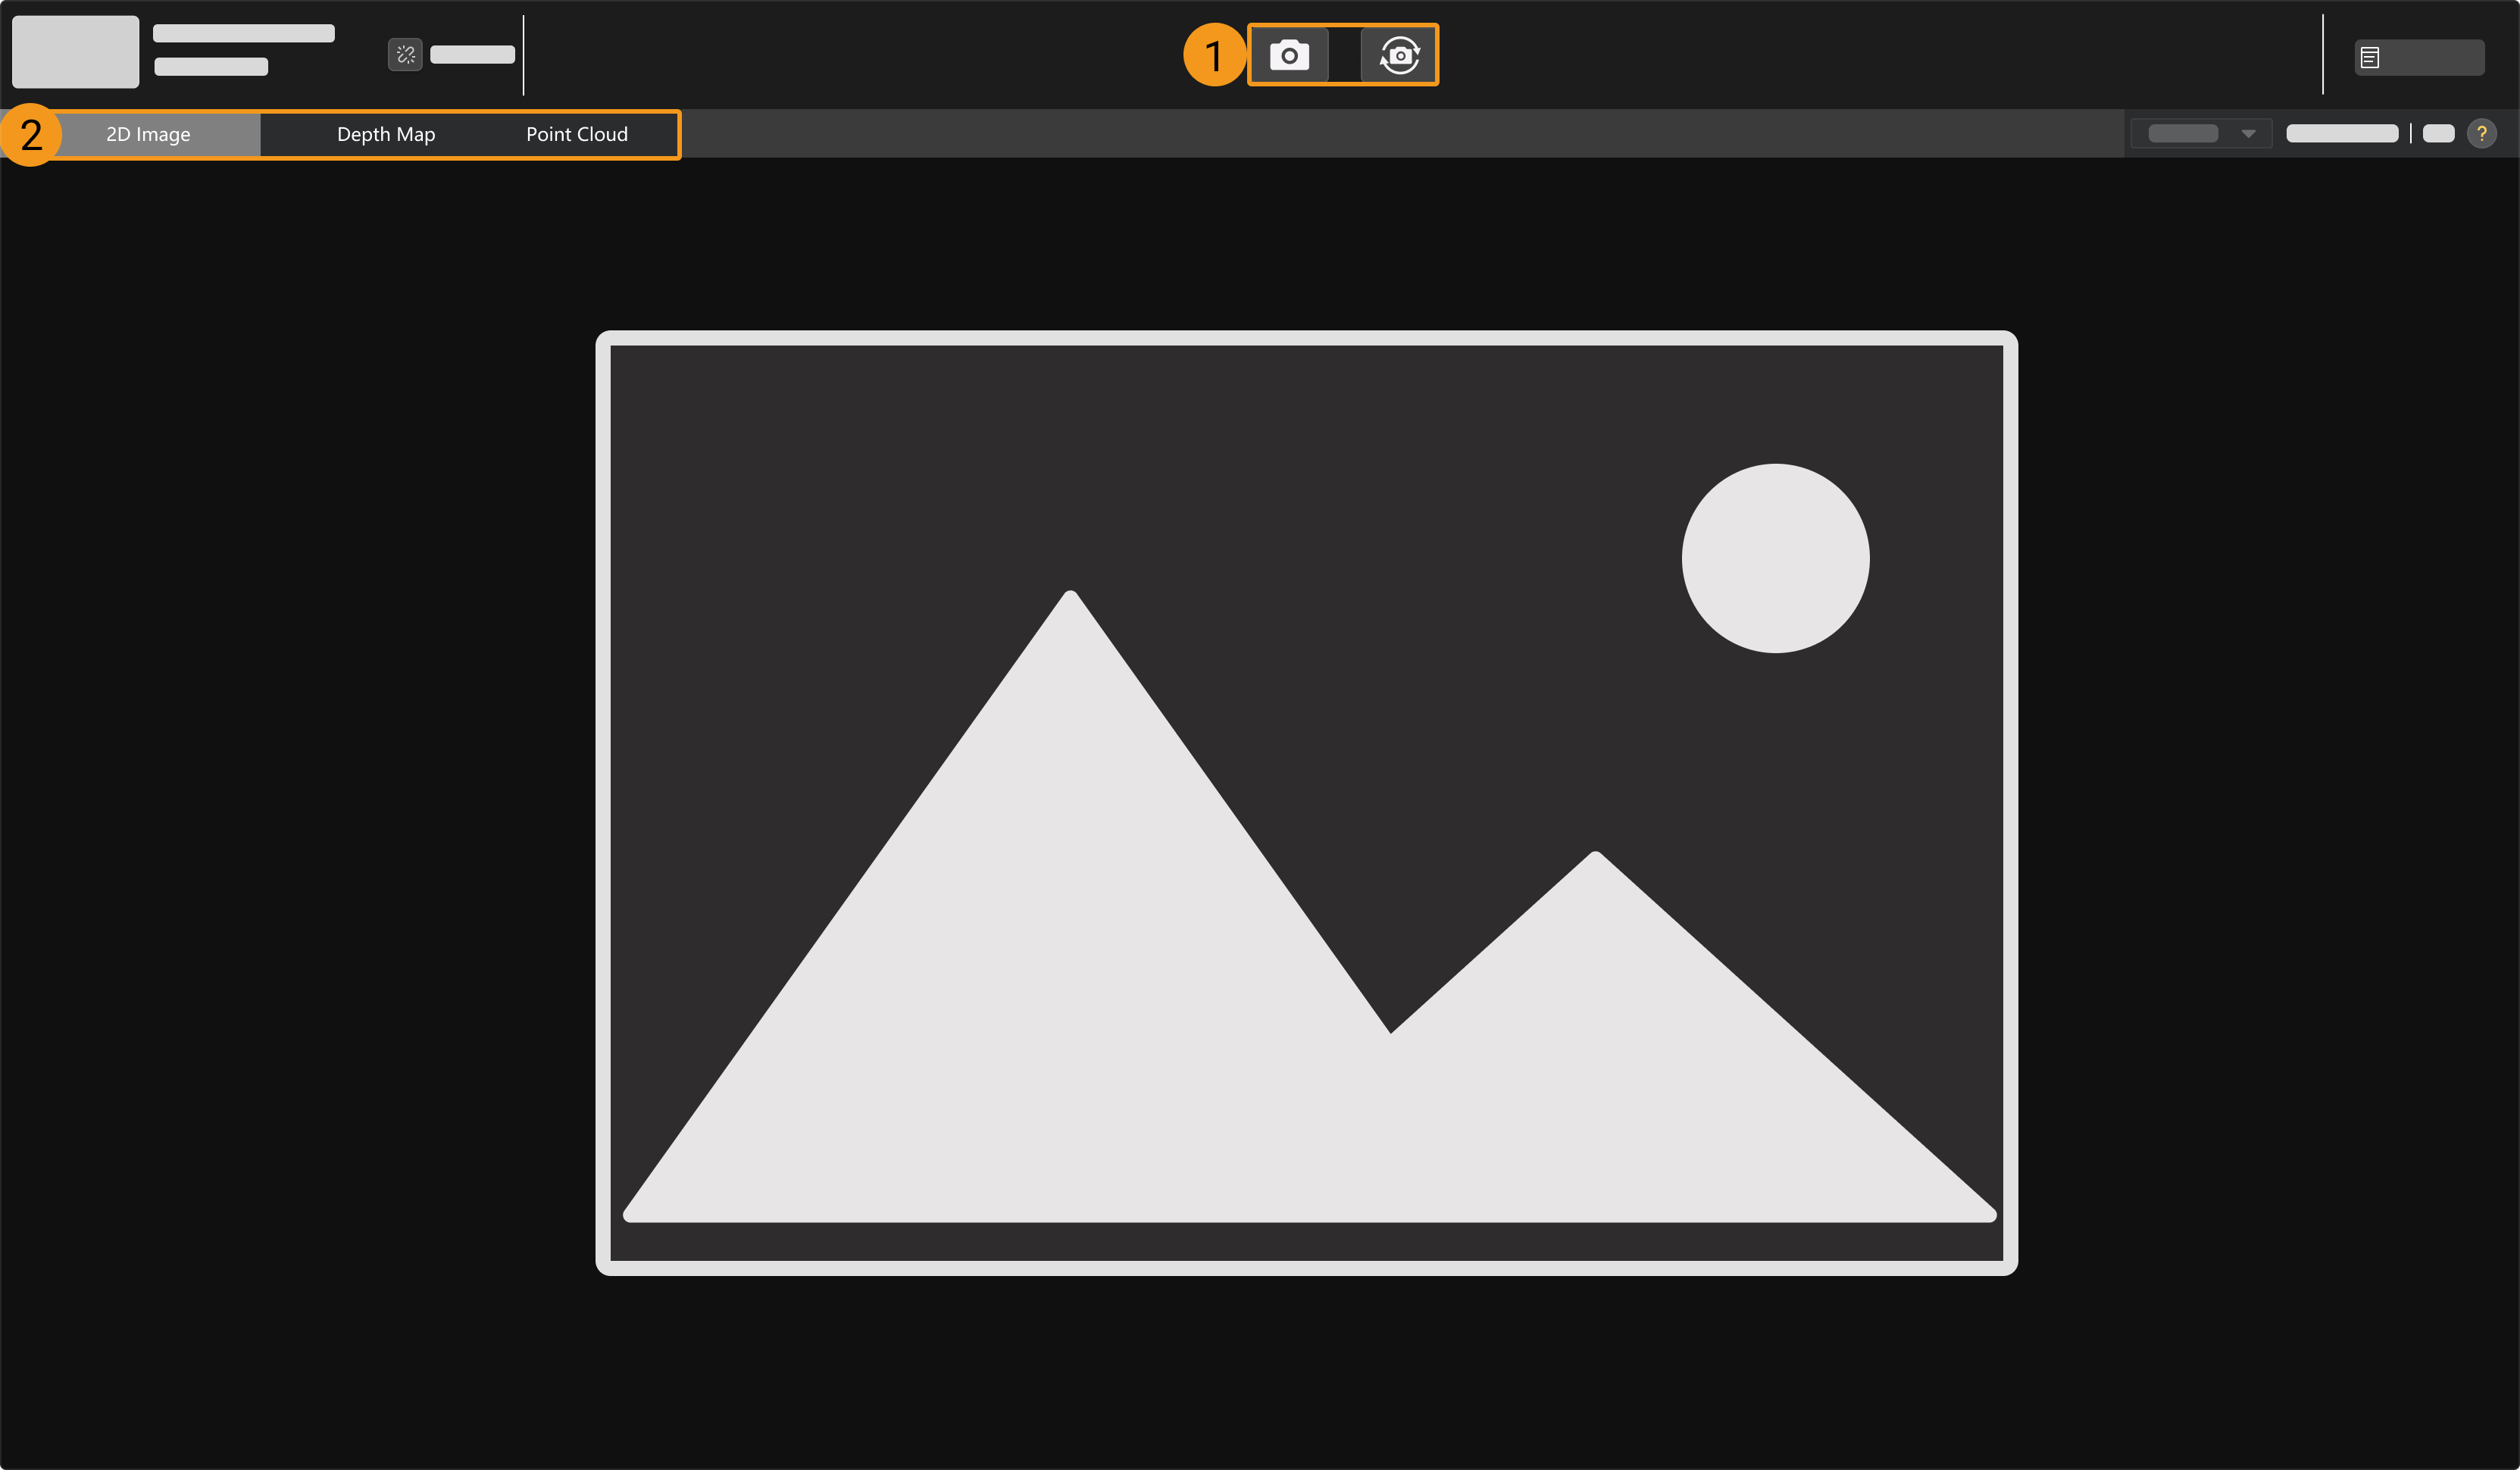
Once the camera is successfully connected, the following interface is displayed. In this interface, you can acquire and view the data.
-
Capture images
-
Switch data type
Capture Images
There are two ways to acquire data:
-
 : Acquire data once.
 -
 : Acquire data continuously at predetermined intervals. Click again to stop data acquisition.
| For an explanation of the data acquisition and output process of structured-light cameras, please refer to Imaging Mechanism of Structured-Light Camera. |
Switch Data Type
The camera outputs multiple types of data to Mech-Eye Viewer. Click the corresponding button to switch the displayed data type.
The types of data output by different camera models differ.
-
The data output by models other than the DEEP-GL (V4) and LSR (V4) series include the following types:
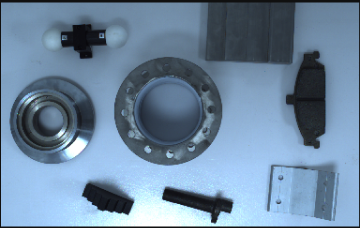
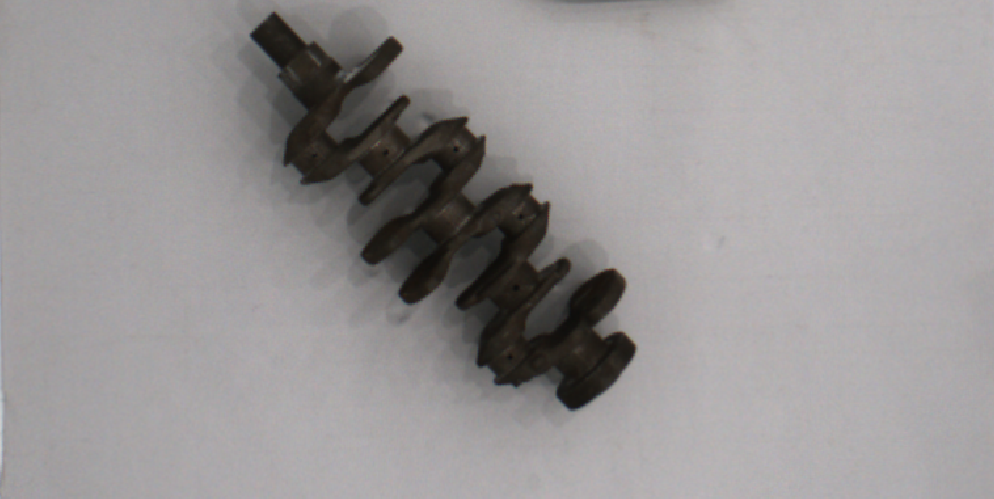
Data type Description Example 2D image
The 2D image used for texturing the point cloud
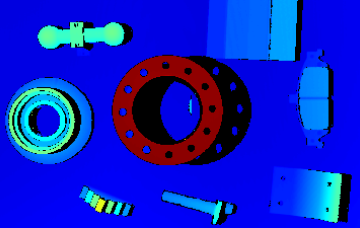
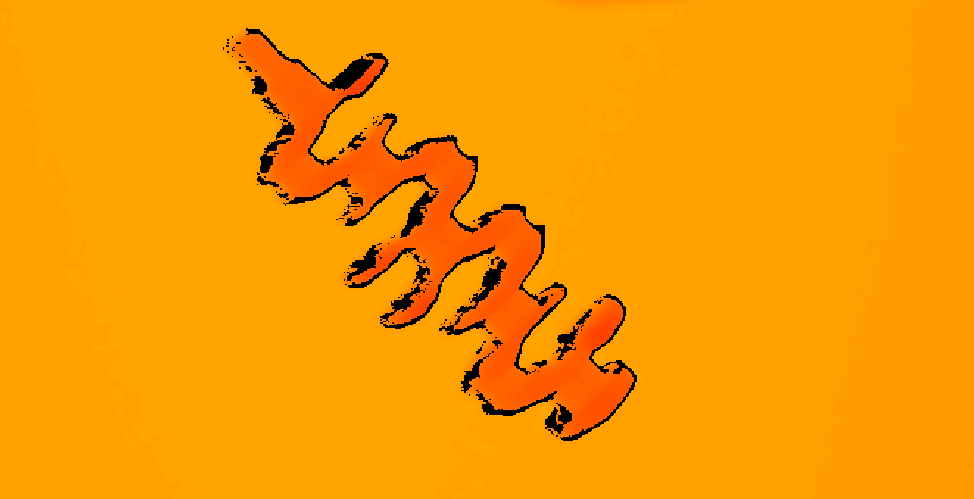
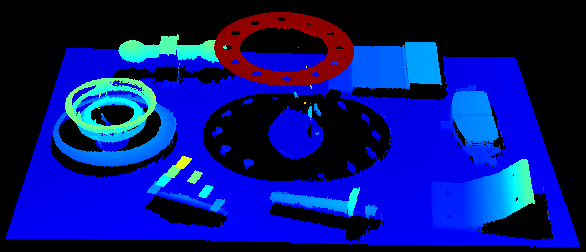
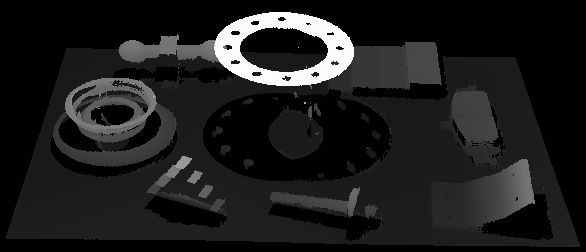
Depth map
A 2D image containing depth information
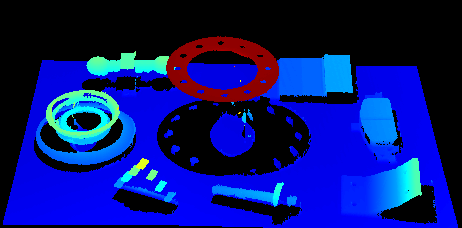
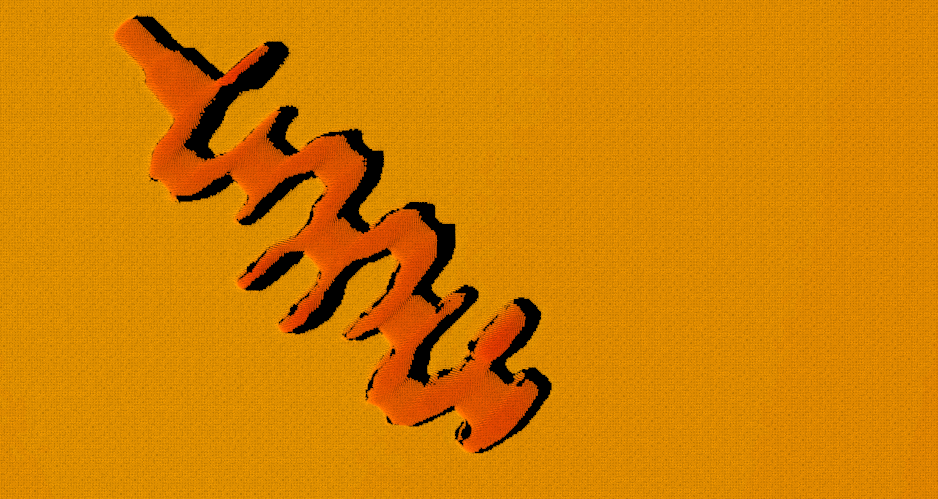
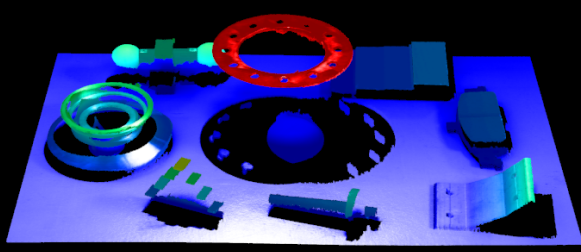
Point cloud
A collection of data points that represent the 3D shape of the object surface
-
The data output by the DEEP-GL (V4) and LSR (V4) series include the following types:
Data type Description Example 2D image (texture)
The 2D image used for texturing the point cloud
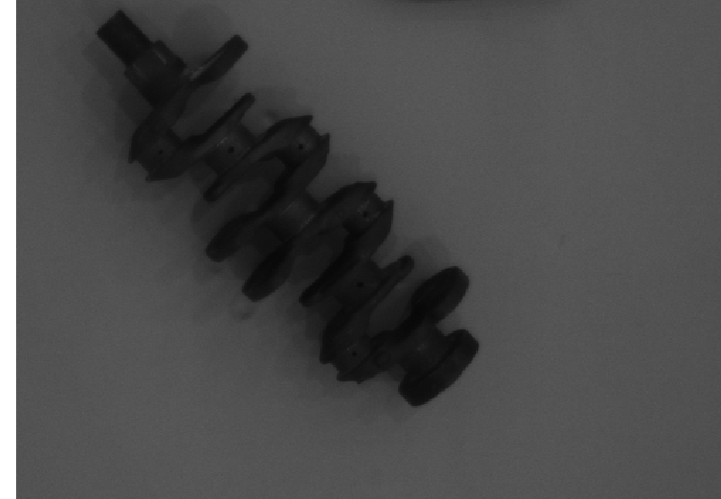
2D images (depth source)
The 2D images captured by the 2D cameras that acquire the depth data
Depth map
A 2D image containing depth information
Point cloud
A collection of data points that represent the 3D shape of the object surface
| The 2D images (depth source) are used in hand-eye calibration, checking intrinsic parameters and setting ROI. |
Adjust Data Display
In the data display area, you can adjust the display of the data through mouse actions, keyboard, and buttons and menus in the software interface.
The instructions below are divided by data types.
Adjust 2D Image Display
In the 2D image display, you can perform the following actions:
-
Zoom: While the cursor is on the 2D image, scroll the mouse wheel to zoom the 2D image.
-
Move: While the 2D image is zoomed in, hold and drag to move the 2D image.
-
Reset size: Right-click the 2D image and select Reset View to fit it to the window.
-
Check pixel position and RGB/grayscale values: In the image information box at the lower right of the 2D image, you can check the pixel position and RGB/grayscale values of the pixel where the cursor is located.
-
The pixel position of the upper-left corner of the image is (0, 0).
-
To hide the image information box, uncheck Image Information Box in the View menu.
-
Adjust Depth Map Display
In the depth map display, you can perform the following actions:
-
Zoom: While the cursor is on the depth map, scroll the mouse wheel to zoom the depth map.
-
Move: While the depth map is zoomed in, hold and drag to move the depth map.
-
Reset size: Right-click the depth map and select Reset View to fit it to the window.
-
Check pixel position and coordinates: In the image information box at the lower right of the depth map, you can check the pixel position and coordinates in the camera reference frame of the pixel where the cursor is located.
-
The pixel position of the upper-left corner of the image is (0, 0).
-
To hide the image information box, uncheck Image Information Box in the View menu.
-
-
Adjust depth data display: The display of the depth data can be adjusted in the left panel. For detailed instructions, please refer to Adjust Depth Data Display.
| A grid can be displayed on the depth map to help you locate the center of the FOV. Through the Depth Map Grid option in the View menu, select to display a 2 × 2 or 3 × 3 grid. |
Adjust Point Cloud Display
In the point cloud display, you can perform the following actions:
-
Zoom: Scroll the mouse wheel to zoom the point cloud.
-
Rotate: Hold the left mouse button and drag to rotate the point cloud.
-
Pan: Hold the mouse wheel and drag to pan the point cloud.
-
Adjust depth data display: The display of the depth data can be adjusted in the left panel. For detailed instructions, please refer to Adjust Depth Data Display.
-
In the upper-right corner of the display area, click the
 icon to enable/disable the measurement feature. After the measurement feature is enabled, the following icons are displayed on the interface:
Icon Functionalities 
Click this icon, press Shift, and click the left mouse button to select two points on the point cloud to measure the straight-line distance between them.

Click this icon, press Shift, and click the left mouse button to select three points on the point cloud to measure the angle between two edges.

Click this icon, press Shift, and click the left mouse button to select any three points on a circle on the point cloud to calculate its diameter.

Click this icon to display all measurement results on the point cloud. When this feature is disabled, only the most recent measurement result is displayed on the point cloud.
-
Use the icons on the right side of the data display area to adjust the display of the point cloud and reference frame:
Icon Functionalities 
Hold and drag the icon to rotate the view. Click one of the circles to rotate the view so that the coordinate axis on the custom reference frame represented by the circle points forward.
For example, click the -X circle to rotate the view so that the negative direction of the X-axis of the custom reference frame points forward.
Hold and drag the icon to pan the view.

Hold and drag the icon to zoom the point cloud.

Click the icon to adjust the point cloud and reference frame to fit the window size.

Click the icon to switch between the perspective and orthographic view for the point cloud.

After clicking the icon, the window prompts the key or mouse button that you press. Click the icon again to stop the prompts.

Click the icon to display the reference frame grid. Click the icon again to hide the grid.

Click this icon to display the FOV of the 2D cameras and projector in the form of view cones.

Click this icon to move the point cloud along a predetermined trajectory to display it from various angles. Click it again to stop displaying the point cloud.

Click this icon to display the point cloud ROI. Click it again to exit the ROI mode. For detailed instructions, please refer to Adjust Point Cloud ROI.
Adjust Point Cloud ROI
In the point cloud ROI, you can use the mouse to adjust the ROI in the following methods:
-
Hold the Ctrl key and drag with the mouse to move or resize the point cloud ROI.
-
Hold both Ctrl and Space to rotate the ROI using the mouse.
In the Point Cloud ROI menu at the lower-left corner of the interface, you can also adjust the ROI’s position, size, and orientation by setting the following parameters:
-
X-Axis Center Position: sets the X-axis coordinate of the center of the point cloud ROI box.
-
Y-Axis Center Position: sets the Y-axis coordinate of the center of the point cloud ROI box.
-
Z-Axis Center Position: sets the Z-axis coordinate of the center of the point cloud ROI box.
-
Length: sets the length of the point cloud ROI box.
-
Width: sets the width of the point cloud ROI box.
-
Height: sets the height of the point cloud ROI box.
-
X-Axis Rotation Angle: sets the rotation angle of the point cloud ROI box around the X-axis.
-
Y-Axis Rotation Angle: sets the rotation angle of the point cloud ROI box around the Y-axis.
-
Z-Axis Rotation Angle: sets the rotation angle of the point cloud ROI box around the Z-axis.
|
Adjust Depth Data Display
In the left panel of the depth map or point cloud display, you can adjust the display reference frame, color rendering, and range of the depth data.
Change Reference Frame
In the Reference Frame menu at the top of the left panel, you can select the reference frame used for displaying the depth data.
-
Device (default): displays the depth data in the camera reference frame.
-
Custom: displays the depth data in the custom reference frame defined by the user.
| The reference frame setting is simultaneously applied to both depth map and point cloud. |
Change Color Rendering
In the Color menu in the left panel, you can choose the color rendering scheme of the depth data.
The Jet, Grayscale, and Jet + intensity options are available for both the depth map and point cloud. When one of these three options is selected, the depth range of the color rendering can be adjusted.
| Option | Description | Example |
|---|---|---|
Jet |
Depth values are displayed in different colors of the jet color scheme. |
|
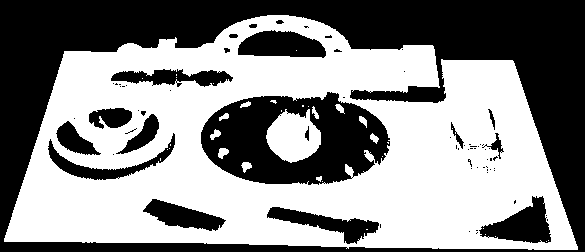
Grayscale |
Depth values are displayed in different shades of gray. |
|
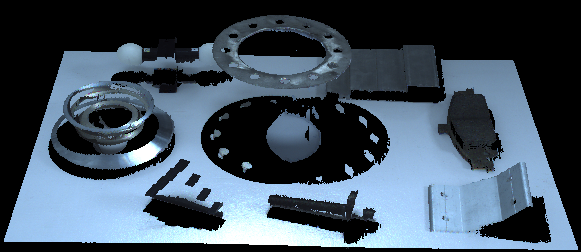
Jet + intensity |
The intensity information of the object surface is overlaid on the jet color scheme. Suitable for checking the object surface features and depth changes at the same time. |
|
The Untextured and Textured options are only available for the point cloud.
| Option | Description | Example |
|---|---|---|
Untextured |
Displays the untextured, white point cloud. |
|
Textured |
Display the point cloud textured with the 2D image. |
|
| When Untextured or Textured is selected, if you switch to the depth map display and then switch back to the point cloud display, the Color setting will be automatically changed to the option selected in the depth map display. |
Adjust Point Size
You can adjust the point size of the point cloud by setting the Point Size parameter on the left side of the interface.
Adjust Depth Range of Color Rendering
When the depth map and point cloud are displayed in Jet, Grayscale or Jet + intensity, every time data acquisition is performed, Mech-Eye Viewer automatically adjusts the color rendering according to the range of the obtained depth data.
With the functions in the Range section of the left panel, you can adjust the depth range in which the color is rendered, in order to conveniently observe the depth variation in a specific range.
| The depth range of color rendering is simultaneously applied to both depth map and point cloud. |
Examples of suitable scenarios:
-
Observe the depth variation of an area on the workpiece surface to check if this area is flat enough.
-
Accentuate the display of a certain workpiece.
Follow these steps to adjust the color rendering range of the depth data:
-
Adjust the range of depth data to be displayed: adjust the Min and Max values at the two ends of the slider. Depth data outside this range is not displayed. You can first adjust this parameter to an appropriate range to eliminate the unneeded depth data.
-
Check the rough depth: On the depth map, move the cursor to the area to be observed, and check the third value of Coordinates in the image information box in the lower right. This is the depth value.
-
Adjust depth range of color rendering: Move the slider handles or enter the depth values on the right of the slider to adjust the depth range of color rendering according to your needs.
-
When using the UHP series, you can change the unit to μm on the right of the slider.
-
After adjusting the range, the depth values outside this range are displayed in the colors corresponding to the minimum/maximum depth values.
-
-
Lock the range: If you need to compare the depth variations in the same range across multiple acquisitions, you can click the Lock icon
 above the slider. When you acquire data again, the depth range of color rendering manually adjusted will be used.
|
To change back to the automatically adjusted range, click the lock icon |
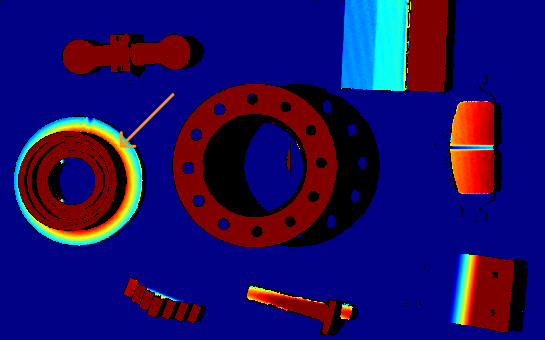
Adjustment example for suitable scenario 1
Goal: Check whether the surface pointed by the orange arrow is flat enough.
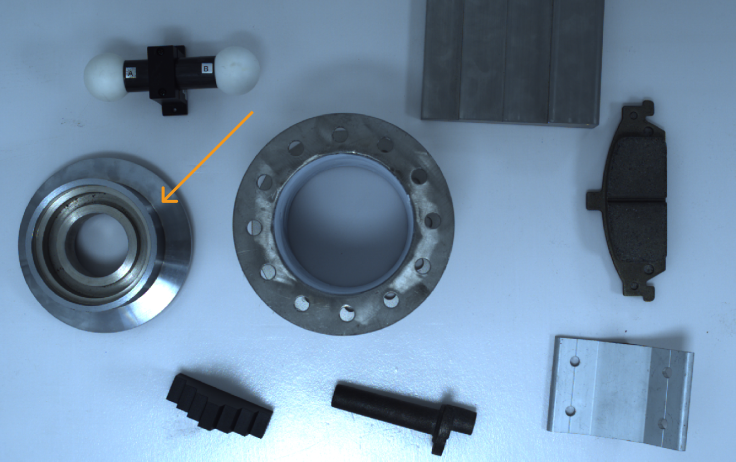
-
In the depth map, this surface appears to be roughly the same color. It is hard to tell if the surface is perfectly flat or not.
-
Move the cursor onto the surface and check the depth value in the image information box in the lower right (about 0.829 m).
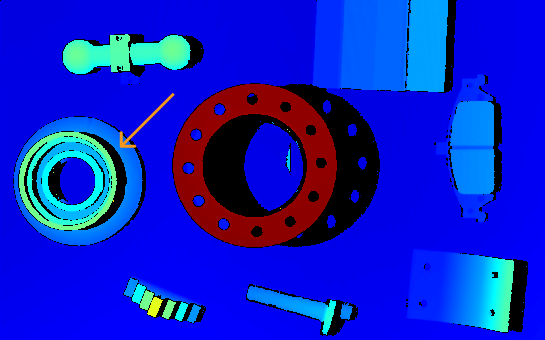
-
Move the slider handles or enter the depth values to adjust the depth range of color rendering to 825–835 mm.
-
Check the depth map again. Now the depth variation of this surface can be easily observed with the color variation.
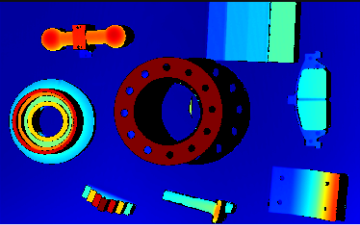
Adjustment example for suitable scenario 2
Goal: Accentuate the display of the workpiece pointed by the orange arrow.
-
On the depth map, move the cursor to the highest and lowest part of the workpiece, and check the depth values in the image information box in the lower right (about 0.795 m and 0.829 m).
-
Move the slider handles or enter the depth values to adjust the depth range of color rendering to 790–850 mm.
-
Check the depth map again. Now the workpiece is displayed in more colors, which makes it stands out.
View Virtual Device Files
To open a virtual device, click in the menu bar.
You can perform the following operations on a virtual device:
-
Click the
button in the data acquisition area to view the acquired data. -
Switch the data type.
-
Change the visibility of parameters.
-
Adjust the Point Cloud Processing, Depth Range, and ROI parameters.
-
Save the acquired 2D image, depth map, and point cloud to local.
This topic introduced data acquisition and data types. The next topic will introduce actions related to parameters.