Predict The Heat Map Of Grasp Probability Of The Pick Points
Predicting the probability distribution of Pick Points is suitable for grabbing unknown objects. Input the depth image and color image, use the deep learning algorithm to distinguish the “graspable’ and “ungraspable” features in the image, and predict the grasp probability, output the heat map of grasp probability. The program of this procedure is shown in Figure 1.
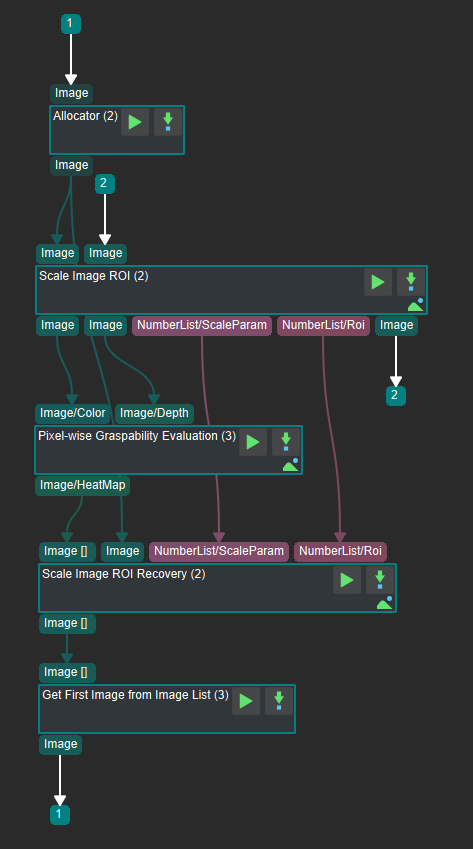
Figure 1 The program of predicting the heat map of grasp probability of the pick points in Mech-Vision
The introduction of each step in the program is as follows :
Scale Image in 2D ROI : Input the original depth image and color image, intercept the region of interest, zoom to the image size required for deep learning and output the color image and depth image after processing.
Pixel-wise Graspability Evaluation : Input the result of the previous step, then use the deep learning algorithm to calculate the grasp probability with each pixel as the center of the end effector and obtain the heat map of the grasp probability of the pick points. The color of the pixel from blue to red represents the probability from low to high, that mean the red area is the graspable area predicted by the model, which will be used in the subsequent calculation of the pick points.
Recover Scaled Images in 2D ROI : Input the result of the previous step and the original color image, restore the scaled heat map of the grasp probability and obtain a list of images.
Get First Image from Image List : Obtain the image corresponding to the first capture of the heat map of grasp probability.