Depth Analyzer
This tool helps check the quality of the depth map. You can open this tool via .
Interface
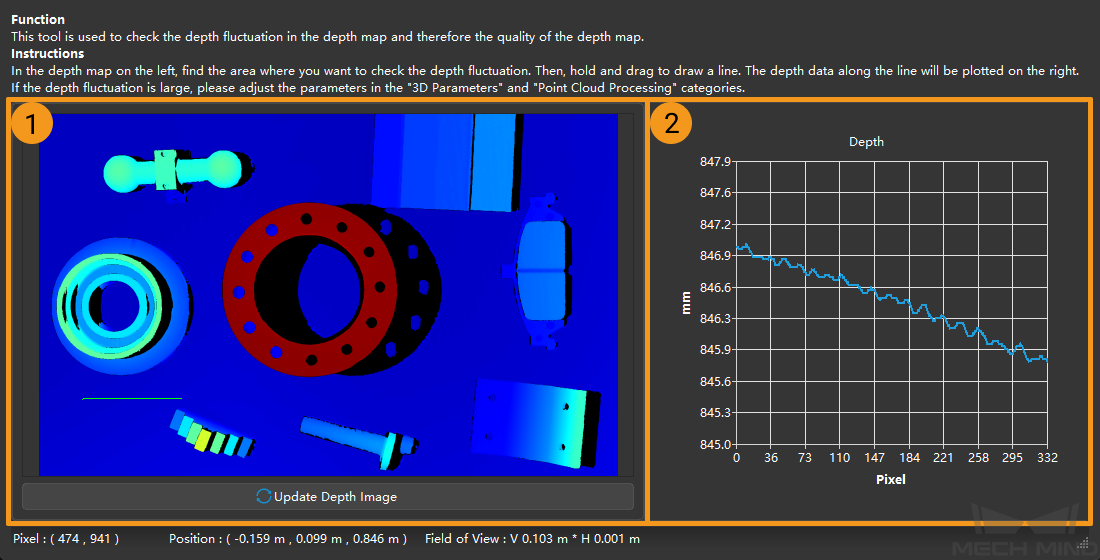
Depth map: display the generated depth map where you can draw a line for generating the depth plot.
Depth plot: display the depth variation along the line drawn on the depth map.
Instructions
On the depth map, locate the area whose depth variation you’d like to check. Draw a line across this area by holding the left mouse button and drag.
A depth plot along the line will be displayed on the right.
Analysis:
Imagine a cross-section of the scene along the line you drew.
The depth plot reflects the depth (height) of object top surfaces along this cross-section.
Pay attention to the Y-axis of the depth plot; the value range is automatically adjusted to the min and max values along the cross-section. Check if the depth fluctuation along the line is within your acceptable range.
If not, please adjust the parameters for depth map to obtain a better result.
